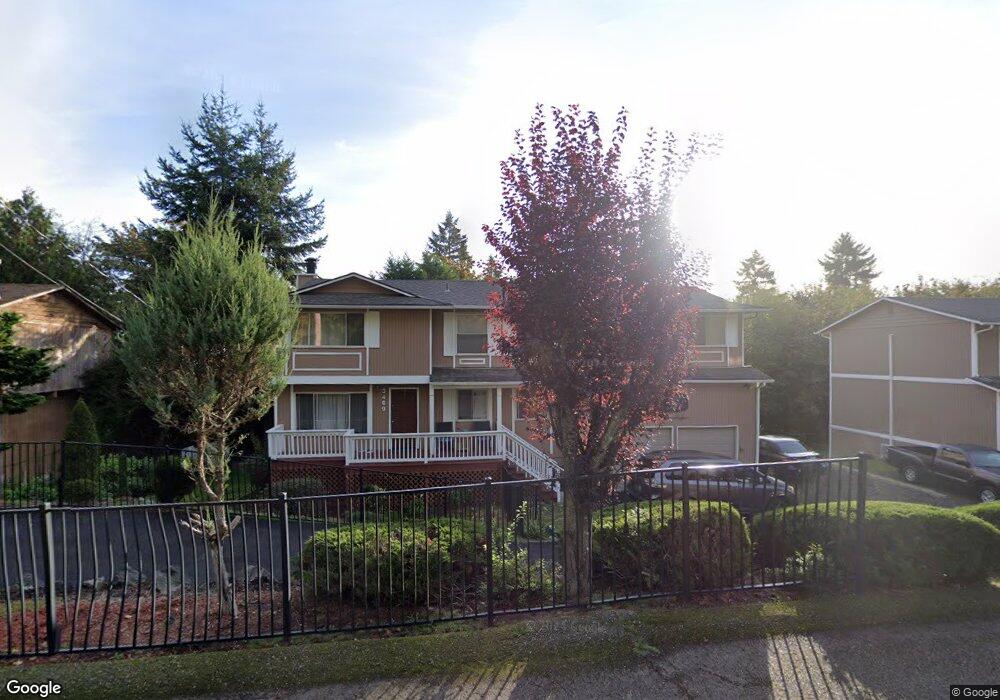
3469 Partridge Hollow NE Bremerton, WA 98310
Estimated Value: $595,000 - $634,345
3
Beds
3
Baths
2,032
Sq Ft
$301/Sq Ft
Est. Value
About This Home
This home is located at 3469 Partridge Hollow NE, Bremerton, WA 98310 and is currently estimated at $612,586, approximately $301 per square foot. 3469 Partridge Hollow NE is a home located in Kitsap County with nearby schools including View Ridge Elementary School, Mountain View Middle School, and Bremerton High School.
Ownership History
Date
Name
Owned For
Owner Type
Purchase Details
Closed on
Oct 25, 2002
Sold by
Federal Home Loan Mortgage Corporation
Bought by
Fannon John W and Fannon Teresita S
Current Estimated Value
Purchase Details
Closed on
May 20, 2002
Sold by
Aiken Arthur R and Aiken Cindy L
Bought by
Federal Home Loan Mortgage Corporation
Purchase Details
Closed on
Jun 26, 1996
Sold by
Martin John M and Martin Penleigh
Bought by
Beneficial Washington Inc
Home Financials for this Owner
Home Financials are based on the most recent Mortgage that was taken out on this home.
Original Mortgage
$119,632
Interest Rate
8.01%
Mortgage Type
FHA
Purchase Details
Closed on
May 28, 1996
Sold by
Beneficial Washington Inc
Bought by
Aiken Arthur R and Aiken Cindy L
Home Financials for this Owner
Home Financials are based on the most recent Mortgage that was taken out on this home.
Original Mortgage
$119,632
Interest Rate
8.01%
Mortgage Type
FHA
Create a Home Valuation Report for This Property
The Home Valuation Report is an in-depth analysis detailing your home's value as well as a comparison with similar homes in the area
Home Values in the Area
Average Home Value in this Area
Purchase History
| Date | Buyer | Sale Price | Title Company |
|---|---|---|---|
| Fannon John W | -- | First American Title Ins | |
| Federal Home Loan Mortgage Corporation | $146,828 | Land Title Co | |
| Beneficial Washington Inc | -- | Land Title Co | |
| Aiken Arthur R | $125,000 | Chicago Title Insurance Co |
Source: Public Records
Mortgage History
| Date | Status | Borrower | Loan Amount |
|---|---|---|---|
| Previous Owner | Aiken Arthur R | $119,632 |
Source: Public Records
Tax History Compared to Growth
Tax History
| Year | Tax Paid | Tax Assessment Tax Assessment Total Assessment is a certain percentage of the fair market value that is determined by local assessors to be the total taxable value of land and additions on the property. | Land | Improvement |
|---|---|---|---|---|
| 2026 | $5,702 | $581,450 | $108,190 | $473,260 |
| 2025 | $5,702 | $581,450 | $108,190 | $473,260 |
| 2024 | $5,508 | $581,450 | $108,190 | $473,260 |
| 2023 | $5,525 | $581,450 | $108,190 | $473,260 |
| 2022 | $5,216 | $485,760 | $90,160 | $395,600 |
| 2021 | $5,141 | $449,730 | $60,070 | $389,660 |
| 2020 | $4,666 | $421,590 | $56,010 | $365,580 |
| 2019 | $4,248 | $380,880 | $50,330 | $330,550 |
| 2018 | $4,497 | $295,980 | $40,590 | $255,390 |
| 2017 | $3,967 | $295,980 | $40,590 | $255,390 |
| 2016 | $3,672 | $259,850 | $35,610 | $224,240 |
| 2015 | $3,305 | $239,050 | $36,070 | $202,980 |
| 2014 | -- | $229,010 | $36,070 | $192,940 |
| 2013 | -- | $245,590 | $38,600 | $206,990 |
Source: Public Records
Map
Nearby Homes
- 3467 Partridge Hollow NE
- 4325 Fir Dr NE
- 36 Illahee Rd NE
- 123 Illahee Rd NE
- 3927 NE Steinman Ln
- 3975 Fischer Park Ave NE
- 3109 NE 40th Place
- 5208 Illahee Rd NE
- 3709 Trenton Ave NE
- 3715 Perry Ave NE
- 5503 Fern Ave NE
- 3335 Trenton Ave
- 2604 Strassburg St NE
- 5600 Oceanview Blvd NE
- 3620 NE Bahia Vista Dr
- 1802 NE Windermere Dr
- 3316 Perry Ave
- 5849 Olive Ave NE
- 3237 Perry Ave NE
- 4209 Westview Dr NE
- 3471 Partridge Hollow NE
- 3470 Partridge Hollow NE
- 3468 Partridge Hollow NE
- 3473 Partridge Hollow NE
- 3465 Partridge Hollow NE
- 3466 Partridge Hollow NE
- 3475 Partridge Hollow NE
- 4560 Fir Dr NE
- 3477 Partridge Hollow NE
- 3464 Partridge Hollow NE
- 4530 Fir Dr NE
- 4500 Fir Dr NE
- 4610 Fir Dr NE Unit A & B
- 4610 Fir Dr NE
- 3456 Partridge Hollow NE
- 4605 Fir Dr NE
- 4460 Fir Dr NE
- 3454 Partridge Hollow NE
- 3400 NE Melissa Place