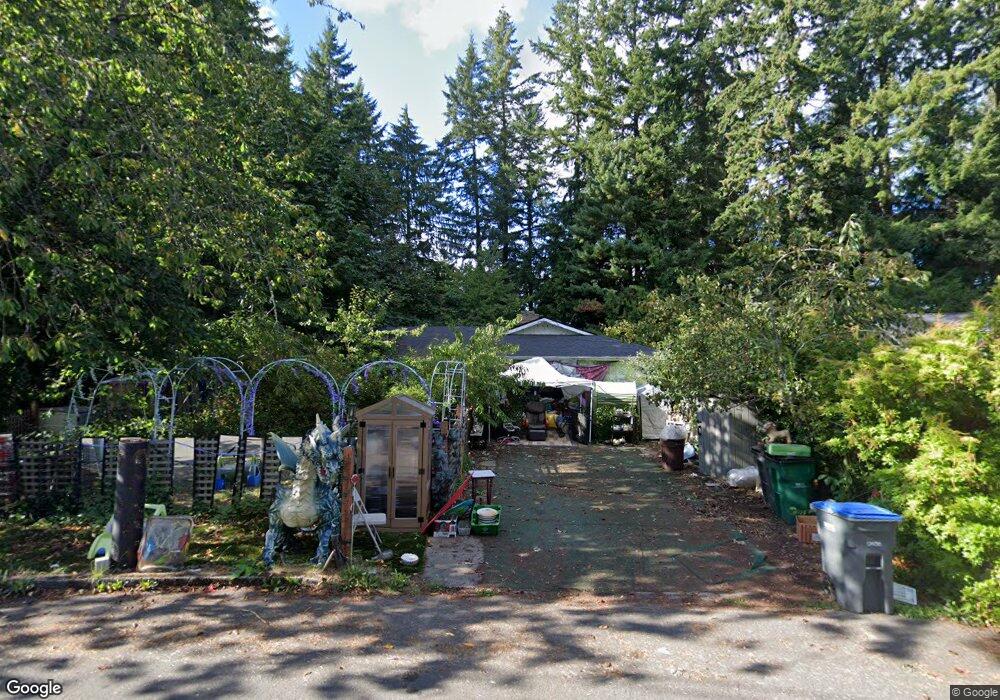
3469 SE Pine Tree Dr Port Orchard, WA 98366
Parkwood NeighborhoodEstimated Value: $492,000 - $525,000
5
Beds
3
Baths
2,016
Sq Ft
$252/Sq Ft
Est. Value
About This Home
This home is located at 3469 SE Pine Tree Dr, Port Orchard, WA 98366 and is currently estimated at $508,218, approximately $252 per square foot. 3469 SE Pine Tree Dr is a home located in Kitsap County with nearby schools including Orchard Heights Elementary School, Marcus Whitman Middle School, and South Kitsap High School.
Ownership History
Date
Name
Owned For
Owner Type
Purchase Details
Closed on
Aug 25, 2010
Sold by
Curry Joshua and Curry Carol
Bought by
Adams Dorthulia G
Current Estimated Value
Home Financials for this Owner
Home Financials are based on the most recent Mortgage that was taken out on this home.
Original Mortgage
$197,342
Outstanding Balance
$130,330
Interest Rate
4.52%
Mortgage Type
FHA
Estimated Equity
$377,888
Purchase Details
Closed on
Nov 10, 2005
Sold by
Jergens James A
Bought by
Curry Joshua and Curry Carol
Home Financials for this Owner
Home Financials are based on the most recent Mortgage that was taken out on this home.
Original Mortgage
$195,200
Interest Rate
6.55%
Mortgage Type
Balloon
Purchase Details
Closed on
Jun 18, 1998
Sold by
Jergens Judith A
Bought by
Jergens James A
Home Financials for this Owner
Home Financials are based on the most recent Mortgage that was taken out on this home.
Original Mortgage
$100,000
Interest Rate
7.17%
Create a Home Valuation Report for This Property
The Home Valuation Report is an in-depth analysis detailing your home's value as well as a comparison with similar homes in the area
Home Values in the Area
Average Home Value in this Area
Purchase History
| Date | Buyer | Sale Price | Title Company |
|---|---|---|---|
| Adams Dorthulia G | $200,280 | Fidelity Ntl Kitsap County | |
| Curry Joshua | $244,280 | Transnation Title | |
| Jergens James A | -- | Land Title Company |
Source: Public Records
Mortgage History
| Date | Status | Borrower | Loan Amount |
|---|---|---|---|
| Open | Adams Dorthulia G | $197,342 | |
| Previous Owner | Curry Joshua | $195,200 | |
| Previous Owner | Jergens James A | $100,000 |
Source: Public Records
Tax History Compared to Growth
Tax History
| Year | Tax Paid | Tax Assessment Tax Assessment Total Assessment is a certain percentage of the fair market value that is determined by local assessors to be the total taxable value of land and additions on the property. | Land | Improvement |
|---|---|---|---|---|
| 2026 | $3,960 | $491,320 | $87,970 | $403,350 |
| 2025 | $3,960 | $450,310 | $73,150 | $377,160 |
| 2024 | $3,840 | $450,310 | $73,150 | $377,160 |
| 2023 | $3,814 | $450,310 | $73,150 | $377,160 |
| 2022 | $3,744 | $370,400 | $68,320 | $302,080 |
| 2021 | $3,625 | $339,360 | $63,480 | $275,880 |
| 2020 | $3,563 | $324,120 | $60,460 | $263,660 |
| 2019 | $2,999 | $298,950 | $59,980 | $238,970 |
| 2018 | $3,139 | $242,640 | $59,980 | $182,660 |
| 2017 | $2,684 | $242,640 | $59,980 | $182,660 |
| 2016 | $2,601 | $215,090 | $59,980 | $155,110 |
| 2015 | $2,519 | $211,010 | $59,980 | $151,030 |
| 2014 | -- | $206,930 | $59,980 | $146,950 |
| 2013 | -- | $202,170 | $63,130 | $139,040 |
Source: Public Records
Map
Nearby Homes
- 2017 SE Juniper Ct
- 2116 Pine Tree Dr SE
- 2124 Pine Tree Dr SE
- 4990 Mile Hill Dr
- 0 Wendell Ave SE
- 1663 Harrison Ave SE
- 2949 SE Mile Hill Dr Unit C7
- 2949 SE Mile Hill Dr Unit C-2
- 3900 SE Mile Hill Dr
- 3930 SE Mile Hill Dr
- 2014 Kelowna Place SE
- 2475 Parkwood Dr SE
- 4010 SE Lovell St
- 2457 White Cedar Dr SE
- 2235 Eisenhower Ave SE
- 2808 Pine Cone Ct SE
- 4258 SE Woodford Ct
- 2313 Lincoln Ave SE
- 0 Lincoln Ave SE
- 3884 Madrona Dr SE
- 3487 Pine Tree Dr SE
- 1776 Payseno Ln SE
- 3453 SE Pine Tree Dr
- 3503 SE Pine Tree Dr
- 3454 SE Pine Tree Dr
- 3427 SE Laurel Ct
- 3494 SE Pine Tree Dr
- 1772 Payseno Ln SE
- 3411 SE Laurel Ct
- 3435 SE Pine Tree Dr
- 3521 SE Pine Tree Dr
- 1676 Payseno Ln SE
- 3438 SE Pine Tree Dr
- 3510 SE Pine Tree Dr
- 0 xxxx SE Mile Hill Dr
- 2018 SE Juniper Ct
- 3537 SE Pine Tree Dr
- 3528 SE Pine Tree Dr
- 1111111 SE Mile Hill Dr