347 34th St Lindenhurst, NY 11757
Estimated Value: $656,000 - $697,000
--
Bed
--
Bath
1,168
Sq Ft
$577/Sq Ft
Est. Value
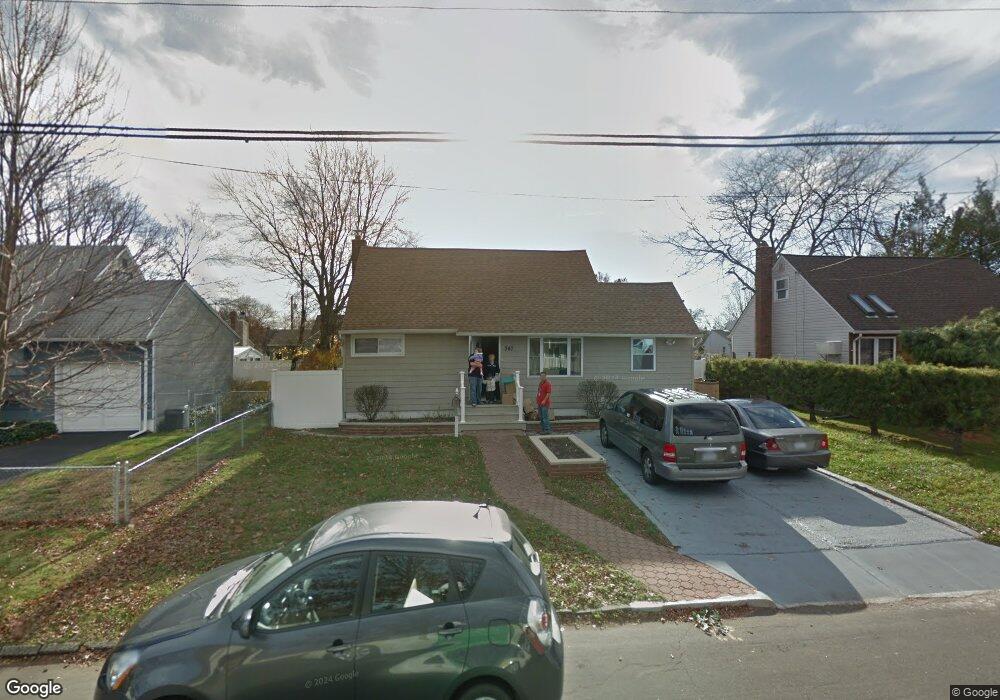
About This Home
This home is located at 347 34th St, Lindenhurst, NY 11757 and is currently estimated at $674,088, approximately $577 per square foot. 347 34th St is a home located in Suffolk County with nearby schools including Albany Avenue Elementary School, Lindenhurst Middle School, and Lindenhurst Senior High School.
Ownership History
Date
Name
Owned For
Owner Type
Purchase Details
Closed on
Nov 3, 2011
Sold by
Varveris Chris
Bought by
Capodicasa Gaspare and Capodicasa Melissa
Current Estimated Value
Home Financials for this Owner
Home Financials are based on the most recent Mortgage that was taken out on this home.
Original Mortgage
$291,049
Outstanding Balance
$200,658
Interest Rate
4.25%
Mortgage Type
FHA
Estimated Equity
$473,430
Purchase Details
Closed on
Apr 28, 2011
Sold by
Mitkowski Michael J and Mitkowski Amy C
Bought by
Varveris Chris
Purchase Details
Closed on
Jun 25, 2002
Sold by
Napolitano James
Bought by
Mitkowski Michael J and Mitkowski Amy C
Home Financials for this Owner
Home Financials are based on the most recent Mortgage that was taken out on this home.
Original Mortgage
$197,925
Interest Rate
6.73%
Mortgage Type
FHA
Create a Home Valuation Report for This Property
The Home Valuation Report is an in-depth analysis detailing your home's value as well as a comparison with similar homes in the area
Home Values in the Area
Average Home Value in this Area
Purchase History
| Date | Buyer | Sale Price | Title Company |
|---|---|---|---|
| Capodicasa Gaspare | $299,000 | -- | |
| Varveris Chris | $200,000 | -- | |
| Mitkowski Michael J | $209,000 | Fidelity National Title |
Source: Public Records
Mortgage History
| Date | Status | Borrower | Loan Amount |
|---|---|---|---|
| Open | Capodicasa Gaspare | $291,049 | |
| Previous Owner | Mitkowski Michael J | $197,925 |
Source: Public Records
Tax History Compared to Growth
Tax History
| Year | Tax Paid | Tax Assessment Tax Assessment Total Assessment is a certain percentage of the fair market value that is determined by local assessors to be the total taxable value of land and additions on the property. | Land | Improvement |
|---|---|---|---|---|
| 2024 | $17,817 | $5,130 | $230 | $4,900 |
| 2023 | $16,211 | $5,130 | $230 | $4,900 |
| 2022 | $7,627 | $5,130 | $230 | $4,900 |
| 2021 | $7,627 | $5,130 | $230 | $4,900 |
| 2020 | $8,035 | $2,920 | $230 | $2,690 |
| 2019 | $8,901 | $0 | $0 | $0 |
| 2018 | $7,537 | $2,920 | $230 | $2,690 |
| 2017 | $7,537 | $2,920 | $230 | $2,690 |
| 2016 | $7,578 | $2,920 | $230 | $2,690 |
| 2015 | -- | $2,920 | $230 | $2,690 |
| 2014 | -- | $2,920 | $230 | $2,690 |
Source: Public Records
Map
Nearby Homes