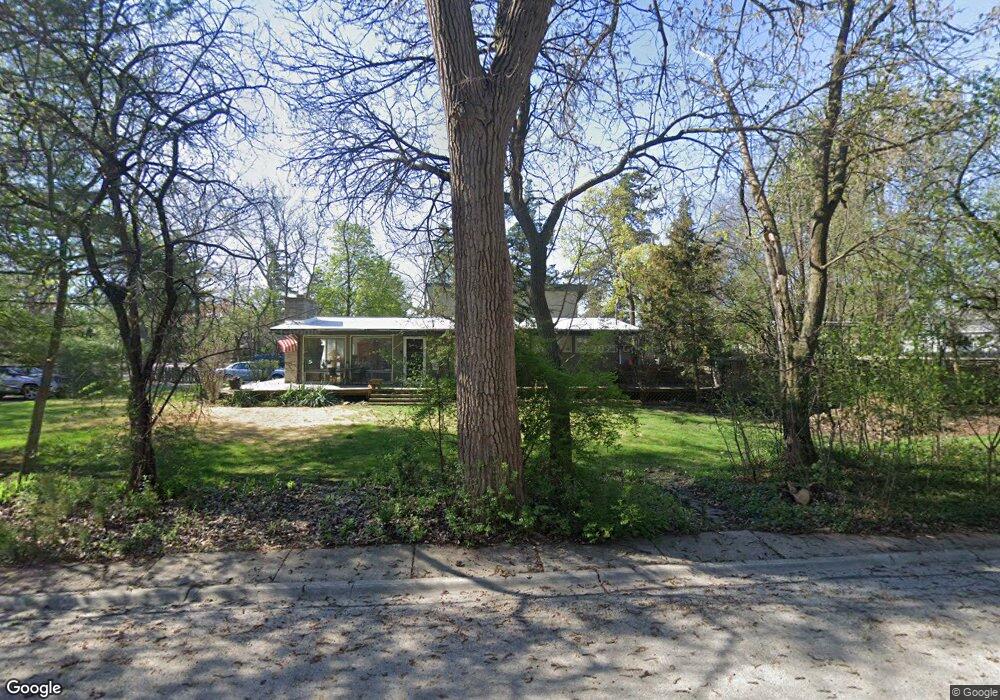
347 40th Place Downers Grove, IL 60515
North Westmont NeighborhoodEstimated Value: $458,000 - $684,000
3
Beds
1
Bath
1,663
Sq Ft
$333/Sq Ft
Est. Value
About This Home
This home is located at 347 40th Place, Downers Grove, IL 60515 and is currently estimated at $553,917, approximately $333 per square foot. 347 40th Place is a home located in DuPage County with nearby schools including Highland Elementary School, Herrick Middle School, and Downer Grove North High School.
Ownership History
Date
Name
Owned For
Owner Type
Purchase Details
Closed on
Aug 28, 2003
Sold by
Smerz James T and Toncray Smerz Cheryl A
Bought by
Whitacre Bradley J and Whitacre Kandi L
Current Estimated Value
Home Financials for this Owner
Home Financials are based on the most recent Mortgage that was taken out on this home.
Original Mortgage
$301,050
Outstanding Balance
$149,738
Interest Rate
7.3%
Mortgage Type
Purchase Money Mortgage
Estimated Equity
$404,179
Purchase Details
Closed on
Mar 25, 1996
Sold by
Johnson James R and Johnson Kimberley A
Bought by
Smerz James T and Toncray Cheryl A
Home Financials for this Owner
Home Financials are based on the most recent Mortgage that was taken out on this home.
Original Mortgage
$190,800
Interest Rate
6.98%
Purchase Details
Closed on
Dec 9, 1995
Sold by
Johnson James R and Johnson Kimberley A
Bought by
Johnson James R and Johnson Kimberley A
Purchase Details
Closed on
Dec 14, 1993
Sold by
Knopik Robert W and Knopik Penelope G
Bought by
Johnson James R and Johnson Kimberley A
Home Financials for this Owner
Home Financials are based on the most recent Mortgage that was taken out on this home.
Original Mortgage
$83,000
Interest Rate
7.25%
Create a Home Valuation Report for This Property
The Home Valuation Report is an in-depth analysis detailing your home's value as well as a comparison with similar homes in the area
Home Values in the Area
Average Home Value in this Area
Purchase History
| Date | Buyer | Sale Price | Title Company |
|---|---|---|---|
| Whitacre Bradley J | $334,500 | -- | |
| Smerz James T | $212,000 | -- | |
| Johnson James R | -- | -- | |
| Johnson James R | $194,500 | Intercounty Title Company |
Source: Public Records
Mortgage History
| Date | Status | Borrower | Loan Amount |
|---|---|---|---|
| Open | Whitacre Bradley J | $301,050 | |
| Previous Owner | Smerz James T | $190,800 | |
| Previous Owner | Johnson James R | $83,000 |
Source: Public Records
Tax History Compared to Growth
Tax History
| Year | Tax Paid | Tax Assessment Tax Assessment Total Assessment is a certain percentage of the fair market value that is determined by local assessors to be the total taxable value of land and additions on the property. | Land | Improvement |
|---|---|---|---|---|
| 2024 | $8,371 | $154,217 | $62,374 | $91,843 |
| 2023 | $7,952 | $141,770 | $57,340 | $84,430 |
| 2022 | $7,436 | $132,350 | $53,530 | $78,820 |
| 2021 | $6,959 | $130,840 | $52,920 | $77,920 |
| 2020 | $6,830 | $128,250 | $51,870 | $76,380 |
| 2019 | $6,611 | $123,060 | $49,770 | $73,290 |
| 2018 | $6,320 | $116,580 | $49,490 | $67,090 |
| 2017 | $6,117 | $112,180 | $47,620 | $64,560 |
| 2016 | $5,713 | $102,330 | $45,490 | $56,840 |
| 2015 | $6,762 | $114,110 | $42,800 | $71,310 |
| 2014 | $6,358 | $104,640 | $41,610 | $63,030 |
| 2013 | $6,228 | $104,140 | $41,410 | $62,730 |
Source: Public Records
Map
Nearby Homes
- 248 41st St
- 4218 Florence Ave
- 4111 Douglas Rd
- 4117 Sterling Rd
- Lot 3910 Sterling Rd
- 425 Sherman St
- 3910 Sterling Rd
- 3916 Liberty Blvd
- 3931 Liberty Blvd
- 4532 Sherwood Ave
- 505 Lincoln Ave
- 3730 Sterling Rd
- 3811 N Park St
- 416 Chicago Ave
- 727 Grant St
- 3919 Washington St
- 4133 Lindley St
- 4022 N Grant St
- 541 Chicago Ave
- 2919 35th St
- 4142 Florence Ave Unit 2
- 348 Shady Ln
- 4101 Fairview Ave
- 351 40th Place
- 4106 Florence Ave
- 4103 Fairview Ave
- 4045 Fairview Ave
- 316 41st St
- 4105 Fairview Ave
- 344 Shady Ln
- 4035 Fairview Ave
- 325 41st St
- 324 Shady Ln
- 309 Shady Ln
- 4149 Fairview Ave
- 308 41st St
- 4025 Fairview Ave
- 319 41st St
- 316 Shady Ln
- 4107 Fairview Ave