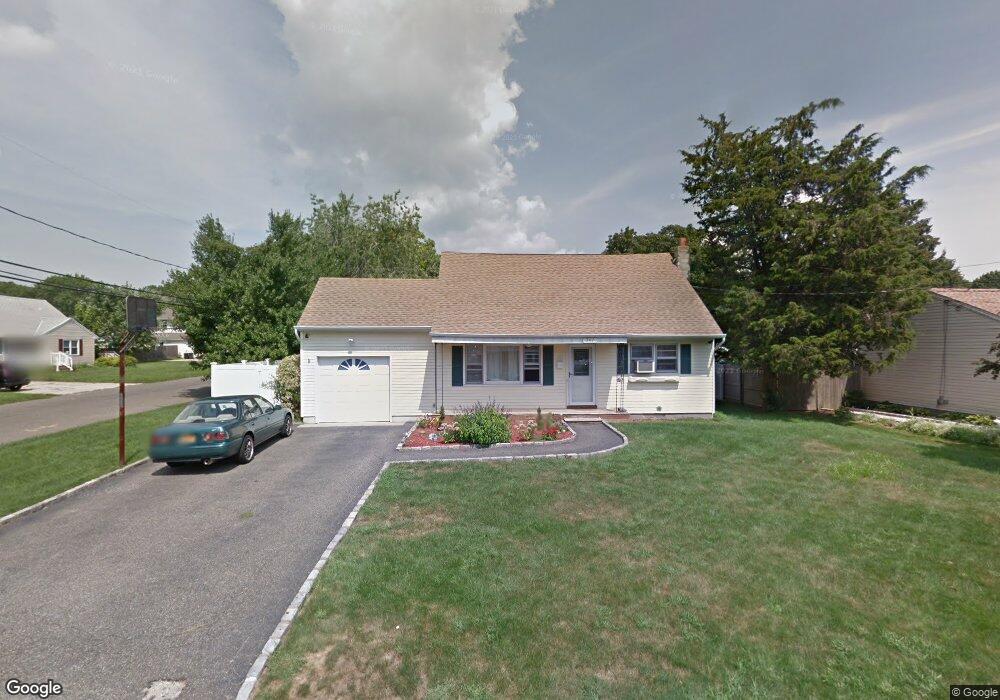
347 Atlantic Ave Bay Shore, NY 11706
Estimated Value: $584,000 - $684,000
--
Bed
--
Bath
--
Sq Ft
8,712
Sq Ft Lot
About This Home
This home is located at 347 Atlantic Ave, Bay Shore, NY 11706 and is currently estimated at $625,786. 347 Atlantic Ave is a home located in Suffolk County with nearby schools including Brook Avenue Elementary School, South Country Elementary School, and Bay Shore Middle School.
Ownership History
Date
Name
Owned For
Owner Type
Purchase Details
Closed on
Nov 8, 2013
Sold by
Roman Amarandi and Roman Mario
Bought by
Roman Amarandi
Current Estimated Value
Purchase Details
Closed on
Aug 17, 2010
Sold by
Martufi Mark
Bought by
Roman Amarandi and Roman Mario
Home Financials for this Owner
Home Financials are based on the most recent Mortgage that was taken out on this home.
Original Mortgage
$296,013
Interest Rate
4.75%
Mortgage Type
FHA
Purchase Details
Closed on
Oct 15, 2003
Sold by
Lehner Charles G
Bought by
Martufi Mark
Create a Home Valuation Report for This Property
The Home Valuation Report is an in-depth analysis detailing your home's value as well as a comparison with similar homes in the area
Home Values in the Area
Average Home Value in this Area
Purchase History
| Date | Buyer | Sale Price | Title Company |
|---|---|---|---|
| Roman Amarandi | -- | -- | |
| Roman Amarandi | $300,000 | -- | |
| Martufi Mark | $303,500 | Pyramid Title |
Source: Public Records
Mortgage History
| Date | Status | Borrower | Loan Amount |
|---|---|---|---|
| Previous Owner | Roman Amarandi | $296,013 |
Source: Public Records
Tax History Compared to Growth
Tax History
| Year | Tax Paid | Tax Assessment Tax Assessment Total Assessment is a certain percentage of the fair market value that is determined by local assessors to be the total taxable value of land and additions on the property. | Land | Improvement |
|---|---|---|---|---|
| 2024 | $10,128 | $35,500 | $6,900 | $28,600 |
| 2023 | $10,128 | $35,500 | $6,900 | $28,600 |
| 2022 | $8,824 | $35,500 | $6,900 | $28,600 |
| 2021 | $8,824 | $35,500 | $6,900 | $28,600 |
| 2020 | $9,504 | $35,500 | $6,900 | $28,600 |
| 2019 | $8,824 | $0 | $0 | $0 |
| 2018 | -- | $35,500 | $6,900 | $28,600 |
| 2017 | $8,802 | $35,500 | $6,900 | $28,600 |
| 2016 | $8,743 | $35,500 | $6,900 | $28,600 |
| 2015 | -- | $35,500 | $6,900 | $28,600 |
| 2014 | -- | $35,500 | $6,900 | $28,600 |
Source: Public Records
Map
Nearby Homes