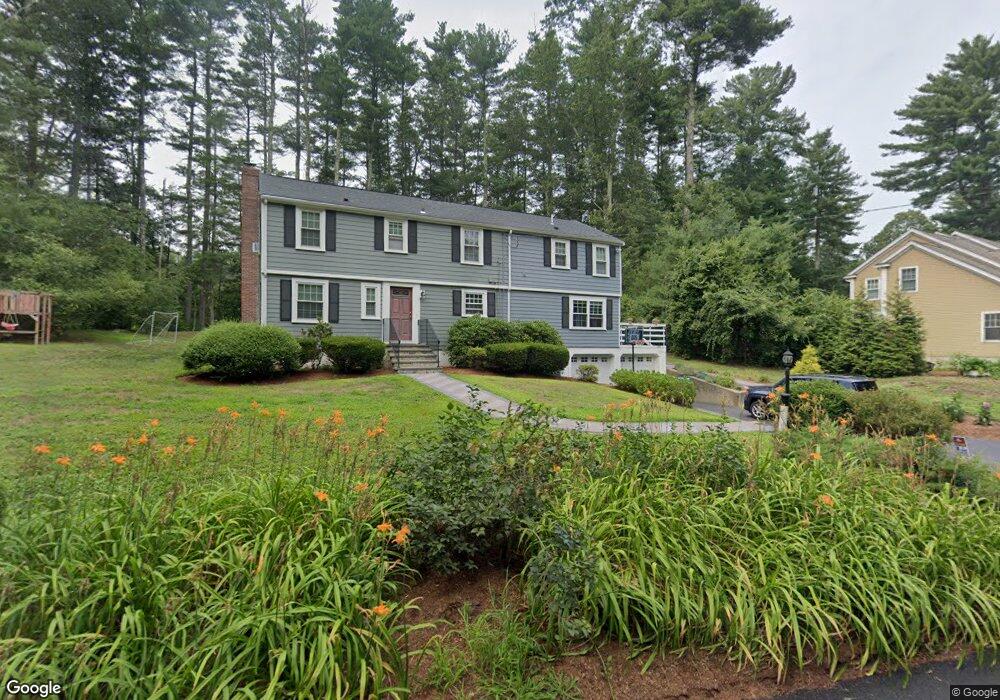
347 Dutton Rd Sudbury, MA 01776
Estimated Value: $806,000 - $1,042,000
4
Beds
2
Baths
1,440
Sq Ft
$661/Sq Ft
Est. Value
About This Home
This home is located at 347 Dutton Rd, Sudbury, MA 01776 and is currently estimated at $951,350, approximately $660 per square foot. 347 Dutton Rd is a home located in Middlesex County with nearby schools including Peter Noyes Elementary School, Ephraim Curtis Middle School, and Lincoln-Sudbury Regional High School.
Ownership History
Date
Name
Owned For
Owner Type
Purchase Details
Closed on
Jan 29, 2008
Sold by
R Sellier T L
Bought by
Rocha Elisa M N and Debeco Nicolas C
Current Estimated Value
Home Financials for this Owner
Home Financials are based on the most recent Mortgage that was taken out on this home.
Original Mortgage
$405,650
Interest Rate
6.17%
Mortgage Type
Purchase Money Mortgage
Purchase Details
Closed on
Oct 3, 2001
Sold by
Ovian Lee A and Ovian Diane M
Bought by
Countryside Est Inc
Home Financials for this Owner
Home Financials are based on the most recent Mortgage that was taken out on this home.
Original Mortgage
$725,000
Interest Rate
6.89%
Mortgage Type
Purchase Money Mortgage
Create a Home Valuation Report for This Property
The Home Valuation Report is an in-depth analysis detailing your home's value as well as a comparison with similar homes in the area
Home Values in the Area
Average Home Value in this Area
Purchase History
| Date | Buyer | Sale Price | Title Company |
|---|---|---|---|
| Rocha Elisa M N | $427,000 | -- | |
| Rocha Elisa M N | $427,000 | -- | |
| Countryside Est Inc | $188,500 | -- | |
| Countryside Est Inc | $188,500 | -- |
Source: Public Records
Mortgage History
| Date | Status | Borrower | Loan Amount |
|---|---|---|---|
| Open | Countryside Est Inc | $395,000 | |
| Closed | Rocha Elisa M N | $405,650 | |
| Previous Owner | Countryside Est Inc | $725,000 |
Source: Public Records
Tax History
| Year | Tax Paid | Tax Assessment Tax Assessment Total Assessment is a certain percentage of the fair market value that is determined by local assessors to be the total taxable value of land and additions on the property. | Land | Improvement |
|---|---|---|---|---|
| 2025 | $11,112 | $759,000 | $439,000 | $320,000 |
| 2024 | $10,715 | $733,400 | $426,200 | $307,200 |
| 2023 | $10,282 | $652,000 | $394,600 | $257,400 |
| 2022 | $10,346 | $573,200 | $362,200 | $211,000 |
| 2021 | $10,161 | $539,600 | $362,200 | $177,400 |
| 2020 | $9,956 | $539,600 | $362,200 | $177,400 |
| 2019 | $9,664 | $539,600 | $362,200 | $177,400 |
| 2018 | $9,831 | $548,300 | $386,200 | $162,100 |
| 2017 | $9,367 | $528,000 | $367,400 | $160,600 |
| 2016 | $9,067 | $509,400 | $353,400 | $156,000 |
| 2015 | $8,372 | $475,700 | $322,800 | $152,900 |
| 2014 | $8,314 | $461,100 | $313,300 | $147,800 |
Source: Public Records
Map
Nearby Homes
- 39 Austin Rd
- 53 Pine St
- 59 Tanbark Rd
- 30 Kendall Rd
- 6 Colburn Cir
- 25 Poplar St
- 30 Rolling Ln
- 69 Robbins Rd
- 0 Robbins Rd
- 0 Boston Post Rd
- 11 Great Lake Dr
- 30 Harness Ln
- 62 Churchill St
- 22 Barracks Rd Unit 22
- 15 Barracks Rd Unit 15
- 11 October Rd
- 25 Adams Rd
- 15 Huckleberry Ln
- 15 Adams Rd
- 45 Webster Cir
Your Personal Tour Guide
Ask me questions while you tour the home.