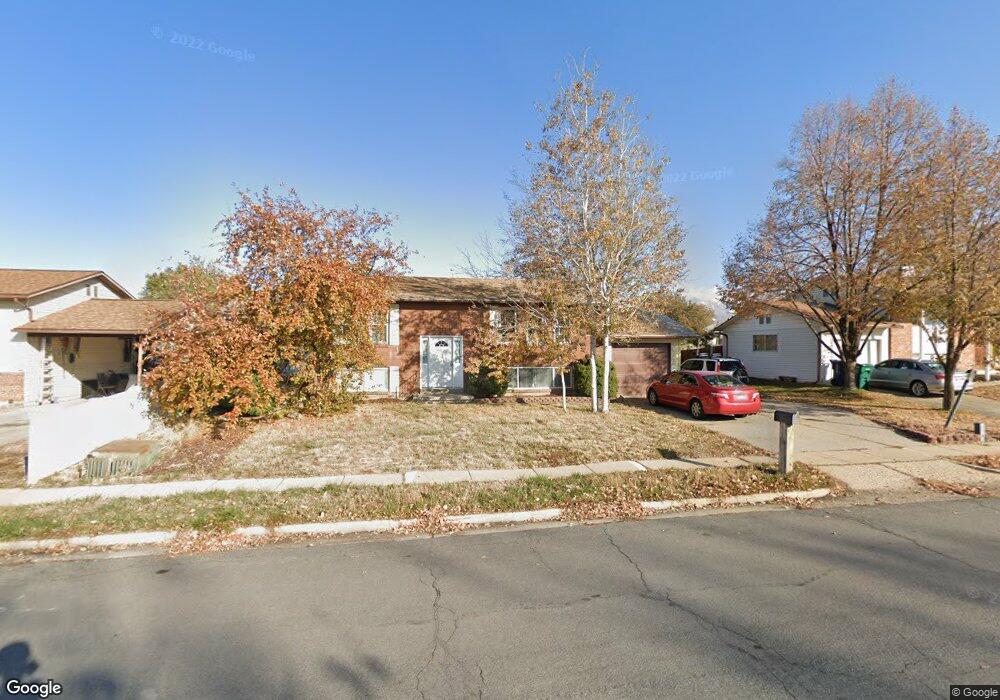
347 E 1250 N Layton, UT 84041
Estimated Value: $420,000 - $449,000
4
Beds
2
Baths
931
Sq Ft
$469/Sq Ft
Est. Value
About This Home
This home is located at 347 E 1250 N, Layton, UT 84041 and is currently estimated at $436,897, approximately $469 per square foot. 347 E 1250 N is a home located in Davis County with nearby schools including King Elementary School, Central Davis Junior High School, and Northridge High School.
Ownership History
Date
Name
Owned For
Owner Type
Purchase Details
Closed on
Jul 30, 2019
Sold by
Horn Bradley S
Bought by
Horn Bradley S and Bradley S Horn Trust
Current Estimated Value
Purchase Details
Closed on
Apr 3, 2012
Sold by
Miller Yuh Chong
Bought by
Horn Bradley S
Purchase Details
Closed on
Jul 6, 2001
Sold by
Robbins May Lin
Bought by
Miller Yuh Chyong
Home Financials for this Owner
Home Financials are based on the most recent Mortgage that was taken out on this home.
Original Mortgage
$79,000
Interest Rate
7.15%
Purchase Details
Closed on
Nov 8, 1996
Sold by
Miller Yuh Chyong
Bought by
Miller Yuh Chyong and Bleakmore Rhiana Lin
Create a Home Valuation Report for This Property
The Home Valuation Report is an in-depth analysis detailing your home's value as well as a comparison with similar homes in the area
Home Values in the Area
Average Home Value in this Area
Purchase History
| Date | Buyer | Sale Price | Title Company |
|---|---|---|---|
| Horn Bradley S | -- | None Available | |
| Horn Bradley S | -- | None Available | |
| Miller Yuh Chyong | -- | Inwest Title Services Inc | |
| Miller Yuh Chyong | -- | Inwest Title Services Inc | |
| Miller Yuh Chyong | -- | Associated Title Company |
Source: Public Records
Mortgage History
| Date | Status | Borrower | Loan Amount |
|---|---|---|---|
| Previous Owner | Miller Yuh Chyong | $79,000 |
Source: Public Records
Tax History
| Year | Tax Paid | Tax Assessment Tax Assessment Total Assessment is a certain percentage of the fair market value that is determined by local assessors to be the total taxable value of land and additions on the property. | Land | Improvement |
|---|---|---|---|---|
| 2025 | $2,065 | $216,700 | $99,118 | $117,582 |
| 2024 | $2,008 | $212,300 | $115,664 | $96,636 |
| 2023 | $1,910 | $356,000 | $139,109 | $216,891 |
| 2022 | $2,000 | $202,400 | $73,071 | $129,329 |
| 2021 | $1,875 | $283,000 | $101,243 | $181,757 |
| 2020 | $1,692 | $245,000 | $85,715 | $159,285 |
| 2019 | $1,678 | $238,000 | $81,892 | $156,108 |
| 2018 | $1,517 | $216,000 | $81,892 | $134,108 |
| 2016 | $1,318 | $96,800 | $25,821 | $70,979 |
| 2015 | $1,227 | $85,580 | $25,821 | $59,759 |
| 2014 | $1,211 | $86,340 | $25,821 | $60,519 |
| 2013 | -- | $77,832 | $18,612 | $59,220 |
Source: Public Records
Map
Nearby Homes
Your Personal Tour Guide
Ask me questions while you tour the home.