Studio
--
Bath
--
Sq Ft
44,431
Sq Ft Lot
About This Home
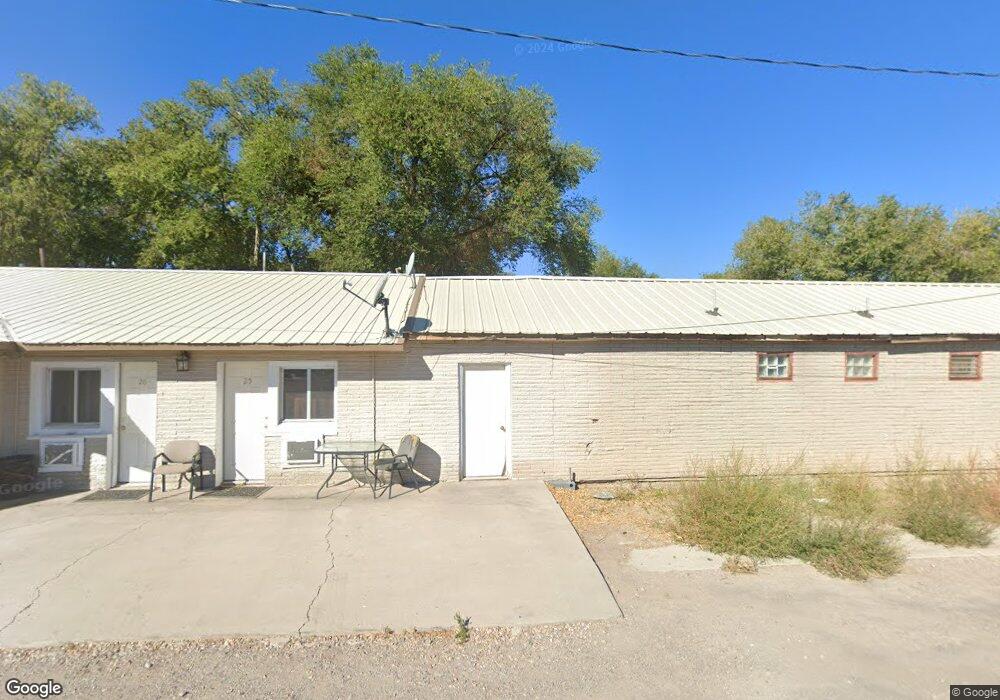
This home is located at 347 E Main St, Delta, UT 84624. 347 E Main St is a home located in Millard County with nearby schools including Cba Center and White River Academy.
Ownership History
Date
Name
Owned For
Owner Type
Purchase Details
Closed on
Dec 30, 2024
Sold by
Michael Dell Van De Vanter Family Trust and Jan Van De Vanter Family Trust
Bought by
Van De Vanter Properties Inc
Purchase Details
Closed on
Sep 6, 2024
Sold by
Vande Vanter Jan
Bought by
Jan Van De Vanter Family Trust and Devanter Van De
Purchase Details
Closed on
Mar 8, 2024
Sold by
Vande Vanter Jan
Bought by
Jan Van De Vanter Family Trust and Devanter Van De
Purchase Details
Closed on
May 25, 2023
Sold by
Vande Vanter Michael Dell
Bought by
Michael Dell Van De Vanter Family Trust and Van De Vanter
Purchase Details
Closed on
Sep 27, 2022
Sold by
George B Hawley Family Trust
Bought by
Charles G & Kathleen Hawley Trust
Purchase Details
Closed on
Feb 8, 2021
Sold by
Vanter Michael Dell Vande
Bought by
Van De Vanter Enterprises Inc
Purchase Details
Closed on
Nov 1, 2006
Sold by
Vande Vanter Mike D and Van De Vanter Michael D
Bought by
Van De Vanter Enterprises Inc
Purchase Details
Closed on
Sep 6, 2006
Sold by
Oldroyd Mark
Bought by
Worthen Russell K and Worthen Tonya
Create a Home Valuation Report for This Property
The Home Valuation Report is an in-depth analysis detailing your home's value as well as a comparison with similar homes in the area
Home Values in the Area
Average Home Value in this Area
Purchase History
| Date | Buyer | Sale Price | Title Company |
|---|---|---|---|
| Van De Vanter Properties Inc | -- | None Listed On Document | |
| Jan Van De Vanter Family Trust | -- | None Listed On Document | |
| Jan Van De Vanter Family Trust | -- | None Listed On Document | |
| Michael Dell Van De Vanter Family Trust | -- | None Listed On Document | |
| Charles G & Kathleen Hawley Trust | -- | -- | |
| Van De Vanter Enterprises Inc | -- | None Available | |
| Van De Vanter Enterprises Inc | -- | -- | |
| Worthen Russell K | -- | -- |
Source: Public Records
Tax History
| Year | Tax Paid | Tax Assessment Tax Assessment Total Assessment is a certain percentage of the fair market value that is determined by local assessors to be the total taxable value of land and additions on the property. | Land | Improvement |
|---|---|---|---|---|
| 2025 | $4,202 | $449,833 | $111,078 | $338,755 |
| 2024 | $4,202 | $204,613 | $90,640 | $113,973 |
| 2023 | $2,560 | $204,613 | $90,640 | $113,973 |
| 2022 | $2,606 | $196,171 | $82,198 | $113,973 |
| 2021 | $2,705 | $194,435 | $82,198 | $112,237 |
| 2020 | $2,722 | $194,435 | $82,198 | $112,237 |
| 2019 | $2,344 | $167,561 | $82,198 | $85,363 |
| 2018 | $2,327 | $167,738 | $82,375 | $85,363 |
| 2017 | $2,309 | $160,349 | $79,976 | $80,373 |
| 2016 | $2,240 | $160,349 | $79,976 | $80,373 |
| 2015 | $2,239 | $160,349 | $79,976 | $80,373 |
| 2014 | -- | $140,670 | $79,976 | $60,694 |
| 2013 | -- | $130,677 | $69,983 | $60,694 |
Source: Public Records
Map
Nearby Homes
- 44 E 300 S
- 87 S 300 East Rd
- 0 E Highway 6 Unit LotWP001 16586023
- 445 Topaz Blvd Unit 10
- 321 E 200 S
- 7900 E 250 Rd N
- 520 E 450 North Rd
- 628 Sunset St
- Locust Ave Unit LotWP001
- 648 Tamarix St
- 163 W 100 S
- 325 N 100 W
- 901 E 750 Rd N
- 341 W 100 S
- 294 S 300 W
- 451 W 300 N
- 2595 E 500 Rd S Unit 3
- 98 W 1000 N
- 700 N Highway 6
- 7430 W 3000 N
Your Personal Tour Guide
Ask me questions while you tour the home.