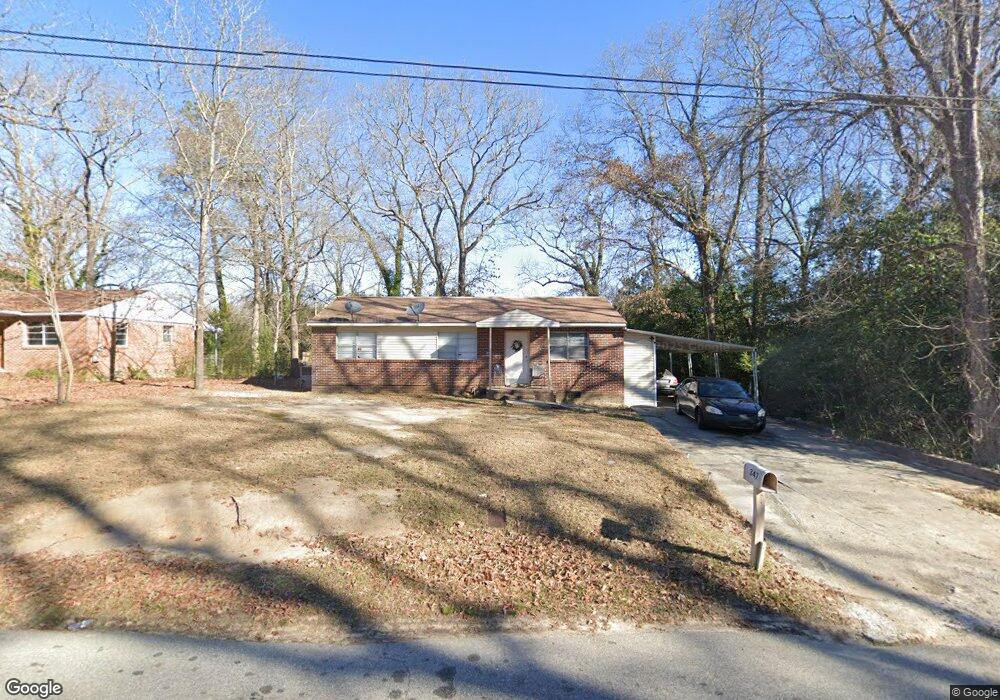
347 Johns Rd Warner Robins, GA 31093
Estimated Value: $102,000 - $151,000
3
Beds
1
Bath
984
Sq Ft
$125/Sq Ft
Est. Value
About This Home
This home is located at 347 Johns Rd, Warner Robins, GA 31093 and is currently estimated at $122,667, approximately $124 per square foot. 347 Johns Rd is a home located in Houston County with nearby schools including Northside Elementary School, Northside Middle School, and Northside High School.
Ownership History
Date
Name
Owned For
Owner Type
Purchase Details
Closed on
Sep 8, 2025
Sold by
Premier Carpet & Duct Cleaning Inc
Bought by
Premier Properties Of Good Hope Llc
Current Estimated Value
Purchase Details
Closed on
Jan 19, 2021
Sold by
Fcs Properties Llc
Bought by
Premier Carpet & Duct Cleaning Inc
Purchase Details
Closed on
Aug 13, 2004
Sold by
Berryhill Henry F and Berryhill Cynthia R
Bought by
Fcs Properties Llc
Purchase Details
Closed on
Dec 9, 2003
Sold by
Bank One National Association
Bought by
Berryhill Henry F and Berryhill Cynthia R
Purchase Details
Closed on
Feb 4, 2003
Sold by
Rogers Jacky L and Rogers Carolyn J
Bought by
Bank One National Association
Purchase Details
Closed on
Oct 1, 1998
Sold by
Rogers Jacky L
Bought by
Rogers Jacky L and Rogers Carolyn J
Purchase Details
Closed on
Sep 1, 1998
Sold by
Rogers Roy L Estate
Bought by
Rogers Hildred A
Purchase Details
Closed on
Jan 1, 1984
Sold by
Rogers Roy L and Rogers Hildred A
Bought by
Rogers Hildred A
Purchase Details
Closed on
May 23, 1963
Bought by
Rogers Roy L and Rogers Hildred A
Create a Home Valuation Report for This Property
The Home Valuation Report is an in-depth analysis detailing your home's value as well as a comparison with similar homes in the area
Home Values in the Area
Average Home Value in this Area
Purchase History
| Date | Buyer | Sale Price | Title Company |
|---|---|---|---|
| Premier Properties Of Good Hope Llc | -- | None Listed On Document | |
| Premier Carpet & Duct Cleaning Inc | $160,000 | None Available | |
| Fcs Properties Llc | -- | -- | |
| Berryhill Henry F | $23,300 | -- | |
| Bank One National Association | $41,200 | -- | |
| Rogers Jacky L | -- | -- | |
| Rogers Jacky L | $35,000 | -- | |
| Rogers Hildred A | -- | -- | |
| Rogers Hildred A | -- | -- | |
| Rogers Roy L | -- | -- |
Source: Public Records
Tax History
| Year | Tax Paid | Tax Assessment Tax Assessment Total Assessment is a certain percentage of the fair market value that is determined by local assessors to be the total taxable value of land and additions on the property. | Land | Improvement |
|---|---|---|---|---|
| 2024 | $565 | $17,280 | $5,000 | $12,280 |
| 2023 | $413 | $12,520 | $2,560 | $9,960 |
| 2022 | $177 | $11,440 | $2,560 | $8,880 |
| 2021 | $229 | $9,920 | $2,560 | $7,360 |
| 2020 | $246 | $10,600 | $2,560 | $8,040 |
| 2019 | $246 | $10,600 | $2,560 | $8,040 |
| 2018 | $246 | $10,600 | $2,560 | $8,040 |
| 2017 | $247 | $10,600 | $2,560 | $8,040 |
| 2016 | $247 | $10,600 | $2,560 | $8,040 |
| 2015 | -- | $10,600 | $2,560 | $8,040 |
| 2014 | -- | $10,600 | $2,560 | $8,040 |
| 2013 | -- | $12,680 | $2,560 | $10,120 |
Source: Public Records
Map
Nearby Homes
- 100 Silas Ct
- 220 Francis St
- 202 Elmwood St
- 300 Ward St
- 249 Ward St
- 108 Smith Place
- 102 Oregon Ct
- 239 Ward St
- 213 King Dr
- 302 Dunmurry Place
- 100 Mauldon Ct
- 405 Dunmurry Place
- 212 Dunmurry Place
- 714 Camellia Cir
- 116 Tabor Dr
- 122 Tabor Dr
- 437 Dunmurry Place
- 302 Hawaii Ave
- 102 Camellia Cir
- 0 Plantation Rd
Your Personal Tour Guide
Ask me questions while you tour the home.