347 Loyd Nelms Rd Nicholson, GA 30565
Estimated Value: $429,764 - $591,000
3
Beds
3
Baths
2,107
Sq Ft
$250/Sq Ft
Est. Value
About This Home
This home is located at 347 Loyd Nelms Rd, Nicholson, GA 30565 and is currently estimated at $527,441, approximately $250 per square foot. 347 Loyd Nelms Rd is a home located in Madison County with nearby schools including Madison County High School.
Ownership History
Date
Name
Owned For
Owner Type
Purchase Details
Closed on
Aug 28, 2020
Sold by
Lane Thomas Andrew
Bought by
Trt Farm Llc
Current Estimated Value
Purchase Details
Closed on
Feb 16, 2018
Sold by
Cooper Ann
Bought by
Ingram Kevin
Purchase Details
Closed on
Jan 16, 2003
Sold by
Cooper Ann P
Bought by
Cooper Marshall E and Cooper Ann P
Purchase Details
Closed on
Sep 10, 1993
Sold by
Cooper Marshall E and Cooper Ann P
Bought by
Cooper Ann P
Create a Home Valuation Report for This Property
The Home Valuation Report is an in-depth analysis detailing your home's value as well as a comparison with similar homes in the area
Home Values in the Area
Average Home Value in this Area
Purchase History
| Date | Buyer | Sale Price | Title Company |
|---|---|---|---|
| Trt Farm Llc | -- | -- | |
| Ingram Kevin | $260,000 | -- | |
| Cooper Marshall E | -- | -- | |
| Cooper Ann P | -- | -- |
Source: Public Records
Tax History Compared to Growth
Tax History
| Year | Tax Paid | Tax Assessment Tax Assessment Total Assessment is a certain percentage of the fair market value that is determined by local assessors to be the total taxable value of land and additions on the property. | Land | Improvement |
|---|---|---|---|---|
| 2024 | $2,076 | $127,554 | $60,438 | $67,116 |
| 2023 | $1,263 | $106,142 | $50,364 | $55,778 |
| 2022 | $1,583 | $84,154 | $34,626 | $49,528 |
| 2021 | $1,419 | $73,362 | $34,626 | $38,736 |
| 2020 | $1,399 | $68,326 | $29,590 | $38,736 |
| 2019 | $1,386 | $67,558 | $29,590 | $37,968 |
| 2018 | $1,096 | $64,144 | $27,072 | $37,072 |
| 2017 | $1,748 | $60,720 | $25,182 | $35,538 |
| 2016 | $801 | $55,495 | $25,182 | $30,312 |
| 2015 | $797 | $55,495 | $25,182 | $30,312 |
| 2014 | $810 | $55,381 | $24,574 | $30,806 |
| 2013 | -- | $55,381 | $24,574 | $30,806 |
Source: Public Records
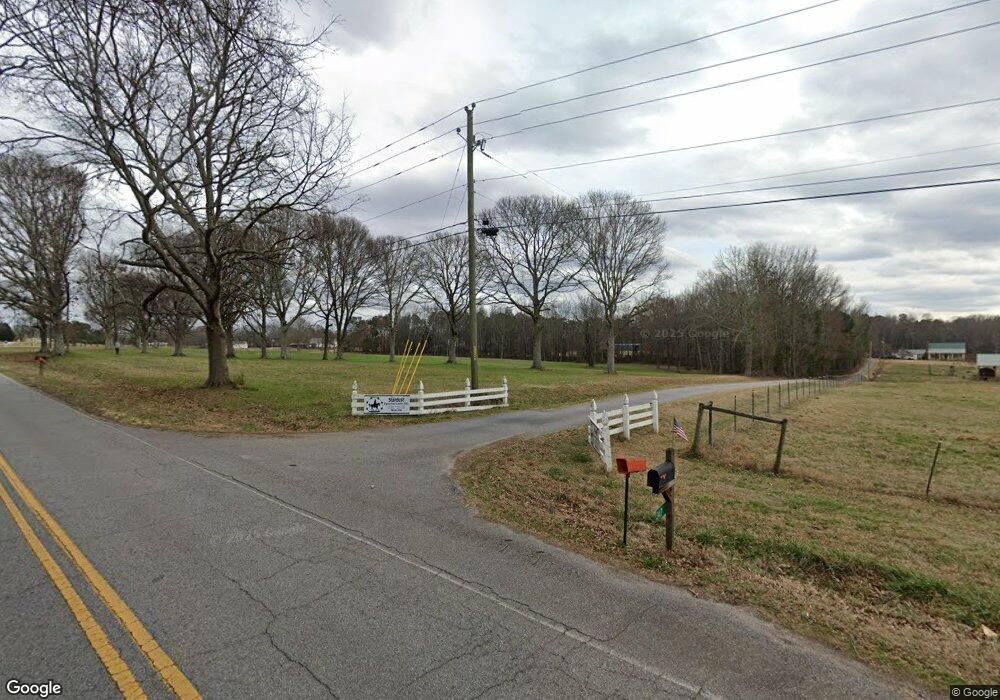
Map
Nearby Homes
- 310 Sawdust Rd
- 1771 Leon Ellis Rd
- 2345 Seagraves Mill Rd
- 260 Oak Cir
- 166 Oak Cir
- 0 Nowhere Ln Unit 10544151
- 1246 Stone Stewart Rd
- 135 Adams Duncan Rd
- 1097 Garnett Ward Rd Unit 1
- 1067 Garnett Ward Rd Unit 2
- 1061 Garnett Ward Rd Unit 3
- 1045 Garnett Ward Rd Unit 4
- 832 Stone Stewart Rd
- 1718 Ed Bennett Rd
- 0 Stone Stewart Rd Unit 7519457
- 0 Stone Stewart Rd Unit 10452697
- 0 Stone Stewart Rd Unit 1023553
- 130 Levi Trail
- 140 Levi Trail
- 424 Belhaven Ln
- 347 Lloyd Nelms Rd
- 587 Loyd Nelms Rd
- 541 Loyd Nelms Rd
- 601 Loyd Nelms Rd
- 0 Sanford Nicholson Rd Unit 3136311
- 0 Sanford Nicholson Rd Unit 7137680
- 0 Sanford Nicholson Rd Unit 7423910
- 0 Sanford Nicholson Rd Unit CM943328
- 0 Sanford Nicholson Rd Unit CM913891
- 0 Sanford Nicholson Rd Unit CM912372
- 0 Sanford Nicholson Rd Unit CM934435
- 0 Sanford Nicholson Rd Unit 10172088
- 0 Sanford Nicholson Rd Unit 973325
- 0 Sanford Nicholson Rd Unit 973326
- 0 Sanford Nicholson Rd Unit 973327
- 0 Sanford Nicholson Rd Unit 20027876
- 0 Sanford Nicholson Rd Unit 7086085
- 0 Sanford Nicholson Rd Unit 7051602
- 0 Sanford Nicholson Rd Unit 9075097
- 0 Sanford Nicholson Rd Unit 8804454