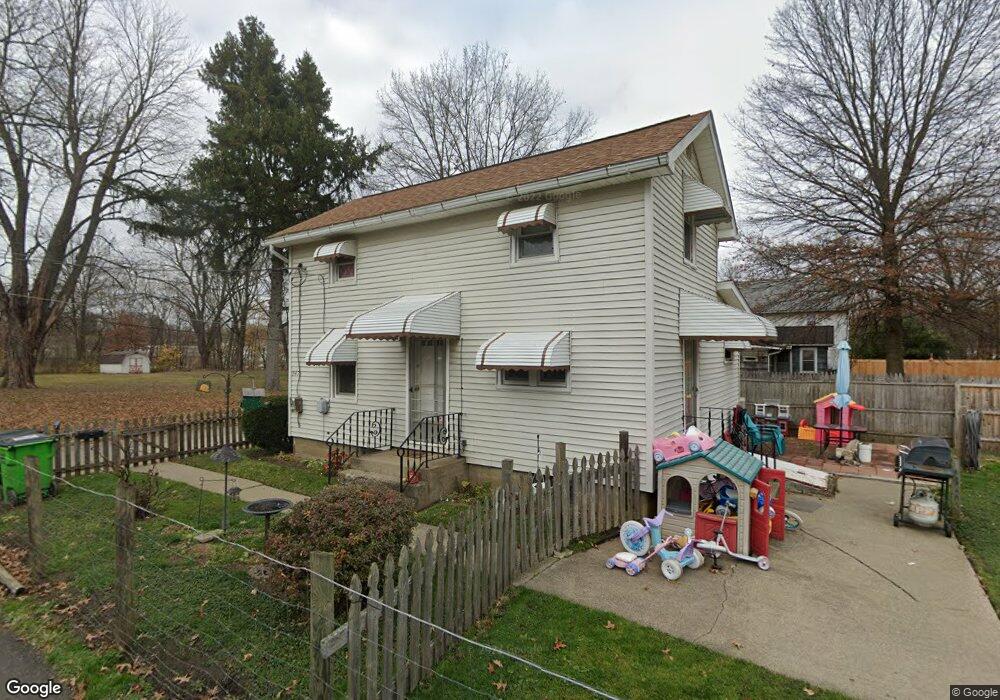
347 Lucca St Wooster, OH 44691
Estimated Value: $78,000 - $113,000
2
Beds
1
Bath
610
Sq Ft
$163/Sq Ft
Est. Value
About This Home
This home is located at 347 Lucca St, Wooster, OH 44691 and is currently estimated at $99,335, approximately $162 per square foot. 347 Lucca St is a home located in Wayne County with nearby schools including Cornerstone Elementary School, Edgewood Middle School, and Wooster High School.
Ownership History
Date
Name
Owned For
Owner Type
Purchase Details
Closed on
Dec 18, 2007
Sold by
Wachovia Bank Na
Bought by
Bailey Steven C
Current Estimated Value
Home Financials for this Owner
Home Financials are based on the most recent Mortgage that was taken out on this home.
Original Mortgage
$26,100
Interest Rate
5.75%
Mortgage Type
New Conventional
Purchase Details
Closed on
Oct 31, 2007
Sold by
Ingold Stephen D and Ingold Rhonda
Bought by
Wachovia Bank Na
Home Financials for this Owner
Home Financials are based on the most recent Mortgage that was taken out on this home.
Original Mortgage
$26,100
Interest Rate
5.75%
Mortgage Type
New Conventional
Purchase Details
Closed on
May 24, 2004
Sold by
Ingold Frank and Ingold Karen
Bought by
Ingold Stephen D
Purchase Details
Closed on
Feb 22, 2001
Sold by
Ganarz Louise H
Bought by
Ingold Frank
Create a Home Valuation Report for This Property
The Home Valuation Report is an in-depth analysis detailing your home's value as well as a comparison with similar homes in the area
Home Values in the Area
Average Home Value in this Area
Purchase History
| Date | Buyer | Sale Price | Title Company |
|---|---|---|---|
| Bailey Steven C | $26,600 | Accutitle Agency Inc | |
| Wachovia Bank Na | $32,500 | None Available | |
| Ingold Stephen D | -- | -- | |
| Ingold Frank | $36,000 | -- |
Source: Public Records
Mortgage History
| Date | Status | Borrower | Loan Amount |
|---|---|---|---|
| Previous Owner | Bailey Steven C | $26,100 |
Source: Public Records
Tax History Compared to Growth
Tax History
| Year | Tax Paid | Tax Assessment Tax Assessment Total Assessment is a certain percentage of the fair market value that is determined by local assessors to be the total taxable value of land and additions on the property. | Land | Improvement |
|---|---|---|---|---|
| 2024 | $563 | $23,290 | $7,620 | $15,670 |
| 2023 | $563 | $23,290 | $7,620 | $15,670 |
| 2022 | $470 | $17,650 | $5,780 | $11,870 |
| 2021 | $485 | $17,650 | $5,780 | $11,870 |
| 2020 | $460 | $17,650 | $5,780 | $11,870 |
| 2019 | $428 | $16,680 | $5,610 | $11,070 |
| 2018 | $429 | $16,680 | $5,610 | $11,070 |
| 2017 | $423 | $16,680 | $5,610 | $11,070 |
| 2016 | $426 | $16,030 | $5,390 | $10,640 |
| 2015 | $418 | $16,030 | $5,390 | $10,640 |
| 2014 | $419 | $16,030 | $5,390 | $10,640 |
| 2013 | $468 | $16,730 | $5,540 | $11,190 |
Source: Public Records
Map
Nearby Homes
- 202 Palmer St
- 638 High St
- 554 Nold Ave
- 733 Spink St
- 804 Belmont Ave
- 548 Spring St
- 1029 E University St
- 1132 E University St
- 329 E Bowman St
- 336 Spring St
- 657 N Bever St
- 534 N Buckeye St
- 708 N Bever St
- 423 N Market St
- 227 N Walnut St
- 229 N Walnut St
- 406 N Walnut St
- 323 N Grant St
- 537 N Grant St
- 900 Quinby Ave