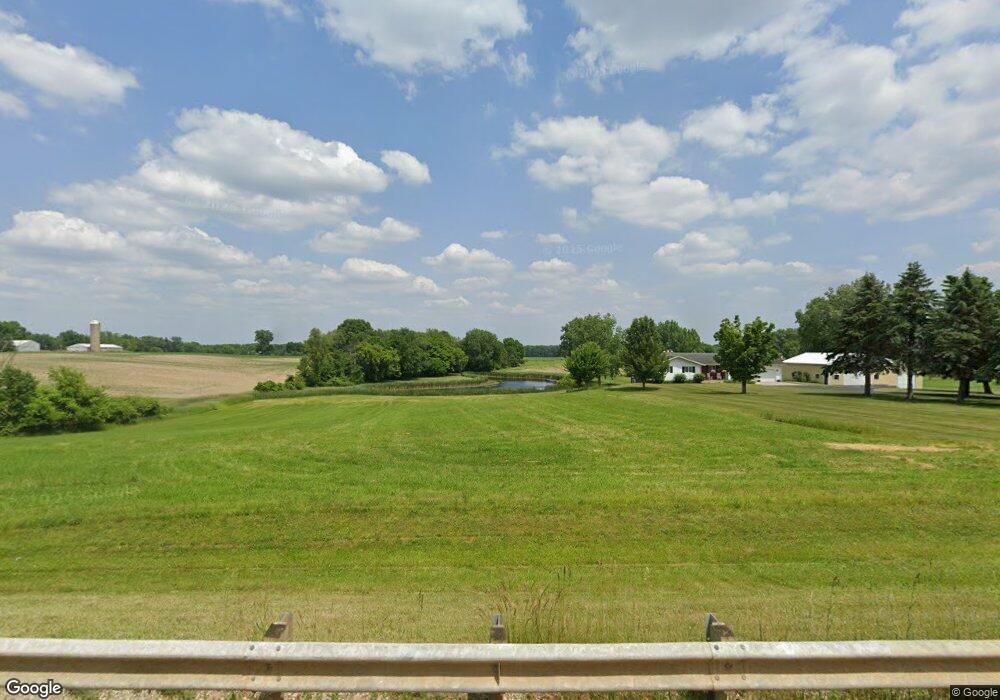
347 M 40 S Allegan, MI 49010
Estimated Value: $241,000 - $397,000
4
Beds
4
Baths
1,520
Sq Ft
$224/Sq Ft
Est. Value
About This Home
This home is located at 347 M 40 S, Allegan, MI 49010 and is currently estimated at $340,793, approximately $224 per square foot. 347 M 40 S is a home located in Allegan County with nearby schools including Pine Trails Elementary School, L.E. White Middle School, and Allegan High School.
Ownership History
Date
Name
Owned For
Owner Type
Purchase Details
Closed on
Apr 5, 2017
Sold by
Woodhams Bonnie L
Bought by
Bonnie L Woodhams Trust
Current Estimated Value
Purchase Details
Closed on
Mar 16, 2017
Sold by
Byers Brenda
Bought by
Woodhams Bonnie L
Purchase Details
Closed on
May 20, 2016
Sold by
Woodhams Bonnie L
Bought by
Bonnie L Woodhams Trust
Purchase Details
Closed on
May 4, 2016
Sold by
Byers Brenda
Bought by
Woodhams Bonnie L
Create a Home Valuation Report for This Property
The Home Valuation Report is an in-depth analysis detailing your home's value as well as a comparison with similar homes in the area
Home Values in the Area
Average Home Value in this Area
Purchase History
| Date | Buyer | Sale Price | Title Company |
|---|---|---|---|
| Bonnie L Woodhams Trust | -- | Attorney | |
| Woodhams Bonnie L | -- | Attorney | |
| Bonnie L Woodhams Trust | -- | None Available | |
| Woodhams Bonnie L | -- | Attorney |
Source: Public Records
Tax History Compared to Growth
Tax History
| Year | Tax Paid | Tax Assessment Tax Assessment Total Assessment is a certain percentage of the fair market value that is determined by local assessors to be the total taxable value of land and additions on the property. | Land | Improvement |
|---|---|---|---|---|
| 2025 | $2,937 | $165,200 | $55,300 | $109,900 |
| 2024 | $2,716 | $140,000 | $40,200 | $99,800 |
| 2023 | $2,716 | $125,300 | $36,200 | $89,100 |
| 2022 | $2,716 | $119,500 | $35,200 | $84,300 |
| 2021 | $3,002 | $109,300 | $32,700 | $76,600 |
| 2020 | $3,002 | $105,400 | $30,200 | $75,200 |
| 2019 | $0 | $97,100 | $29,200 | $67,900 |
| 2018 | $0 | $89,100 | $26,300 | $62,800 |
| 2017 | $0 | $88,800 | $27,200 | $61,600 |
| 2016 | $0 | $83,900 | $26,400 | $57,500 |
| 2015 | -- | $83,900 | $26,400 | $57,500 |
| 2014 | -- | $76,900 | $25,100 | $51,800 |
| 2013 | -- | $70,800 | $20,800 | $50,000 |
Source: Public Records
Map
Nearby Homes