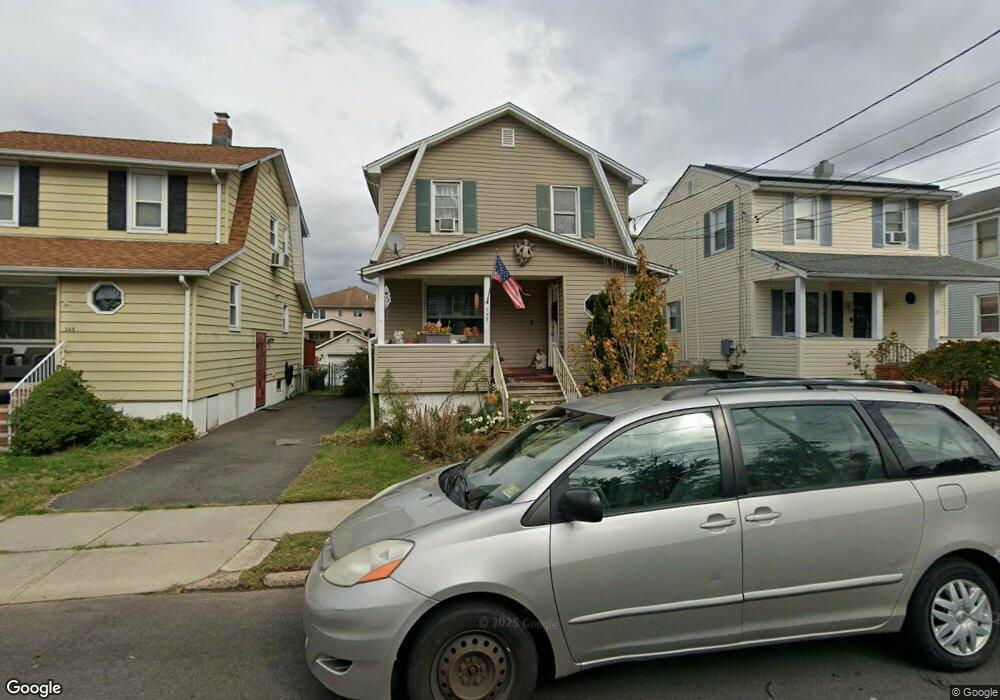
347 Maple Ave Lyndhurst, NJ 07071
Estimated Value: $612,000 - $840,000
4
Beds
3
Baths
1,696
Sq Ft
$403/Sq Ft
Est. Value
About This Home
This home is located at 347 Maple Ave, Lyndhurst, NJ 07071 and is currently estimated at $683,887, approximately $403 per square foot. 347 Maple Ave is a home located in Bergen County with nearby schools including Lyndhurst High School and Sacred Heart School.
Ownership History
Date
Name
Owned For
Owner Type
Purchase Details
Closed on
Feb 12, 1999
Sold by
Hickman Robert T and Estate Of Robert F Hickman
Bought by
Hamczyk Bernard and Hamczyk Jean
Current Estimated Value
Home Financials for this Owner
Home Financials are based on the most recent Mortgage that was taken out on this home.
Original Mortgage
$129,857
Outstanding Balance
$30,789
Interest Rate
6.76%
Mortgage Type
FHA
Estimated Equity
$653,098
Create a Home Valuation Report for This Property
The Home Valuation Report is an in-depth analysis detailing your home's value as well as a comparison with similar homes in the area
Home Values in the Area
Average Home Value in this Area
Purchase History
| Date | Buyer | Sale Price | Title Company |
|---|---|---|---|
| Hamczyk Bernard | $137,000 | -- |
Source: Public Records
Mortgage History
| Date | Status | Borrower | Loan Amount |
|---|---|---|---|
| Open | Hamczyk Bernard | $129,857 |
Source: Public Records
Tax History Compared to Growth
Tax History
| Year | Tax Paid | Tax Assessment Tax Assessment Total Assessment is a certain percentage of the fair market value that is determined by local assessors to be the total taxable value of land and additions on the property. | Land | Improvement |
|---|---|---|---|---|
| 2025 | $10,015 | $486,100 | $308,000 | $178,100 |
| 2024 | $9,654 | $480,100 | $304,000 | $176,100 |
| 2023 | $8,964 | $475,100 | $301,000 | $174,100 |
| 2022 | $8,964 | $282,600 | $156,100 | $126,500 |
| 2021 | $8,591 | $282,600 | $156,100 | $126,500 |
| 2020 | $8,405 | $282,600 | $156,100 | $126,500 |
| 2019 | $8,342 | $282,600 | $156,100 | $126,500 |
| 2018 | $8,410 | $282,600 | $156,100 | $126,500 |
| 2017 | $8,198 | $282,600 | $156,100 | $126,500 |
| 2016 | $8,015 | $282,600 | $156,100 | $126,500 |
| 2015 | $7,763 | $232,900 | $156,100 | $76,800 |
| 2014 | $6,314 | $232,900 | $156,100 | $76,800 |
Source: Public Records
Map
Nearby Homes