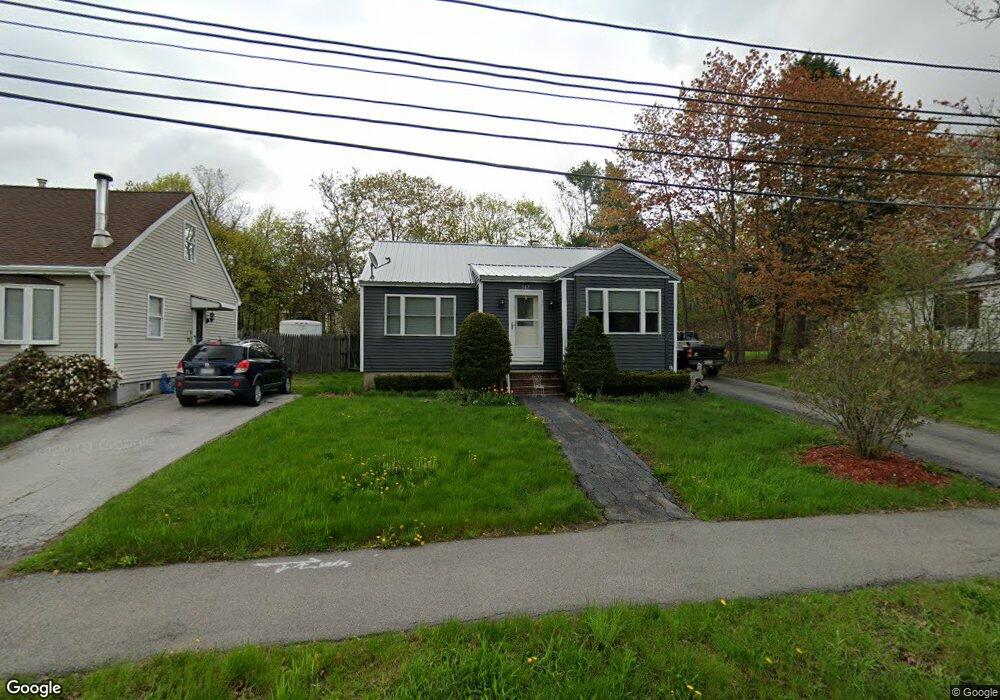
347 Maple St Bangor, ME 04401
Central Bangor NeighborhoodEstimated Value: $226,000 - $273,000
2
Beds
1
Bath
936
Sq Ft
$262/Sq Ft
Est. Value
About This Home
This home is located at 347 Maple St, Bangor, ME 04401 and is currently estimated at $245,537, approximately $262 per square foot. 347 Maple St is a home located in Penobscot County with nearby schools including Fruit Street School, Mary Snow School, and William S. Cohen School.
Ownership History
Date
Name
Owned For
Owner Type
Purchase Details
Closed on
Oct 5, 2009
Sold by
Mccollor Rae L
Bought by
Chasse Elaine M and Chasse Brent A
Current Estimated Value
Home Financials for this Owner
Home Financials are based on the most recent Mortgage that was taken out on this home.
Original Mortgage
$130,545
Outstanding Balance
$85,418
Interest Rate
5.12%
Mortgage Type
FHA
Estimated Equity
$160,119
Purchase Details
Closed on
May 25, 2006
Sold by
Schwarz Marion E
Bought by
Mccollor Rae L
Home Financials for this Owner
Home Financials are based on the most recent Mortgage that was taken out on this home.
Original Mortgage
$126,000
Interest Rate
6.53%
Mortgage Type
FHA
Create a Home Valuation Report for This Property
The Home Valuation Report is an in-depth analysis detailing your home's value as well as a comparison with similar homes in the area
Home Values in the Area
Average Home Value in this Area
Purchase History
| Date | Buyer | Sale Price | Title Company |
|---|---|---|---|
| Chasse Elaine M | -- | -- | |
| Mccollor Rae L | -- | -- |
Source: Public Records
Mortgage History
| Date | Status | Borrower | Loan Amount |
|---|---|---|---|
| Open | Chasse Elaine M | $130,545 | |
| Previous Owner | Mccollor Rae L | $126,000 |
Source: Public Records
Tax History
| Year | Tax Paid | Tax Assessment Tax Assessment Total Assessment is a certain percentage of the fair market value that is determined by local assessors to be the total taxable value of land and additions on the property. | Land | Improvement |
|---|---|---|---|---|
| 2024 | $3,397 | $183,100 | $21,500 | $161,600 |
| 2023 | $3,079 | $160,800 | $20,700 | $140,100 |
| 2022 | $2,860 | $140,200 | $20,700 | $119,500 |
| 2021 | $2,618 | $117,400 | $19,100 | $98,300 |
| 2020 | $2,533 | $109,200 | $18,200 | $91,000 |
| 2019 | $2,431 | $105,700 | $18,200 | $87,500 |
| 2018 | $2,320 | $101,100 | $18,200 | $82,900 |
| 2017 | $2,172 | $96,300 | $18,200 | $78,100 |
| 2016 | $2,120 | $94,200 | $18,200 | $76,000 |
| 2015 | $2,085 | $95,000 | $18,200 | $76,800 |
| 2014 | $2,010 | $92,200 | $18,200 | $74,000 |
| 2013 | $1,920 | $92,300 | $18,200 | $74,100 |
Source: Public Records
Map
Nearby Homes
Your Personal Tour Guide
Ask me questions while you tour the home.