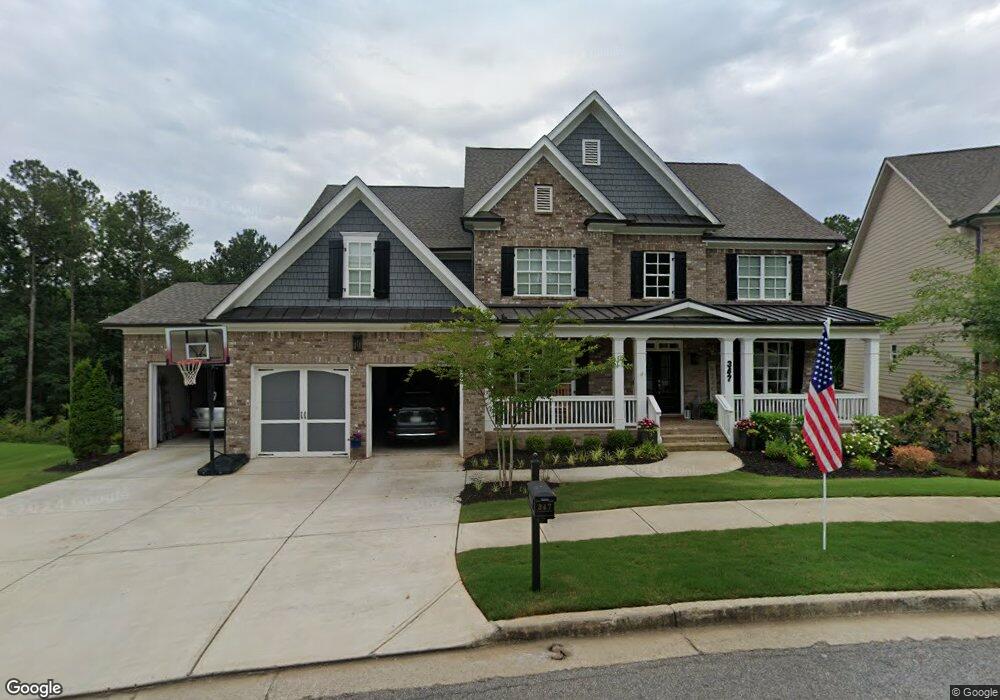
347 Peninsula Point Unit 432 Canton, GA 30115
Estimated Value: $851,548 - $904,000
5
Beds
4
Baths
4,300
Sq Ft
$204/Sq Ft
Est. Value
About This Home
This home is located at 347 Peninsula Point Unit 432, Canton, GA 30115 and is currently estimated at $877,774, approximately $204 per square foot. 347 Peninsula Point Unit 432 is a home located in Cherokee County with nearby schools including Indian Knoll Elementary School, Rusk Middle School, and Sequoyah High School.
Ownership History
Date
Name
Owned For
Owner Type
Purchase Details
Closed on
Jan 11, 2023
Sold by
Stone Davis Katherine
Bought by
Stone Katherine A
Current Estimated Value
Home Financials for this Owner
Home Financials are based on the most recent Mortgage that was taken out on this home.
Original Mortgage
$588,000
Outstanding Balance
$568,183
Interest Rate
6.31%
Mortgage Type
New Conventional
Estimated Equity
$309,591
Purchase Details
Closed on
Dec 5, 2019
Sold by
Reo Funding Solutions Ii Llc
Bought by
Stonecrest Homes Ga Llc
Home Financials for this Owner
Home Financials are based on the most recent Mortgage that was taken out on this home.
Original Mortgage
$484,340
Interest Rate
3.6%
Mortgage Type
New Conventional
Purchase Details
Closed on
Mar 26, 2012
Sold by
Community Bank Of The Sout
Bought by
Reo Funding Solutions Ii Llc
Create a Home Valuation Report for This Property
The Home Valuation Report is an in-depth analysis detailing your home's value as well as a comparison with similar homes in the area
Home Values in the Area
Average Home Value in this Area
Purchase History
| Date | Buyer | Sale Price | Title Company |
|---|---|---|---|
| Stone Katherine A | -- | -- | |
| Stonecrest Homes Ga Llc | -- | -- | |
| Davis Katherine Stone | $567,000 | -- | |
| Reo Funding Solutions Ii Llc | $395,000 | -- |
Source: Public Records
Mortgage History
| Date | Status | Borrower | Loan Amount |
|---|---|---|---|
| Open | Stone Katherine A | $588,000 | |
| Previous Owner | Davis Katherine Stone | $484,340 |
Source: Public Records
Tax History
| Year | Tax Paid | Tax Assessment Tax Assessment Total Assessment is a certain percentage of the fair market value that is determined by local assessors to be the total taxable value of land and additions on the property. | Land | Improvement |
|---|---|---|---|---|
| 2025 | $16,804 | $371,840 | $62,000 | $309,840 |
| 2024 | $9,237 | $341,920 | $58,000 | $283,920 |
| 2023 | $8,906 | $344,960 | $58,000 | $286,960 |
| 2022 | $7,745 | $265,040 | $44,000 | $221,040 |
| 2021 | $6,056 | $245,040 | $39,920 | $205,120 |
| 2020 | $5,635 | $226,800 | $36,435 | $190,365 |
| 2019 | $3,826 | $152,160 | $38,400 | $113,760 |
| 2018 | $972 | $38,400 | $38,400 | $0 |
| 2017 | $321 | $96,000 | $38,400 | $0 |
| 2016 | $321 | $31,200 | $12,480 | $0 |
| 2015 | $270 | $26,000 | $10,400 | $0 |
| 2014 | $169 | $16,200 | $6,480 | $0 |
Source: Public Records
Map
Nearby Homes
- 146 Edgewater Trail
- 140 Edgewater Trail
- 778 Crescent Cir
- 213 Whitetail Cir
- 292 Harmony Lake Dr
- 680 Lorimore Pass
- 354 Ridgewood Trail
- 710 Berkeley Terrace
- 810 Ravenstone Way
- 172 Madison St
- 367 Reserve Overlook
- 242 Harmony Lake Dr
- 408 Long Branch Way
- 312 Hannah Place
- 243 Harmony Lake Dr
- 200 Cherokee Reserve Cir
- 333 Reserve Overlook
- 212 Reserve Crossing
- 177 Treeline Trail
- 207 Reserve Crossing
- 347 Peninsula Point
- 439 Peninsula Point
- 441 Peninsula Point
- 428 Peninsula Point
- 345 Peninsula Point
- 349 Peninsula Point
- 338 Peninsula Point
- 338 Peninsula Point Unit 430
- 343 Peninsula Point
- 343 Peninsula Point Unit 434
- 341 Peninsula Point
- 341 Peninsula Point Unit 435
- 334 Peninsula Point
- 336 Peninsula Point
- 1065 Stover Rd
- 339 Peninsula Point
- 330 Peninsula Pte
- 328 Peninsula Point
- 332 Peninsula Point
- 337 Peninsula Point
Your Personal Tour Guide
Ask me questions while you tour the home.