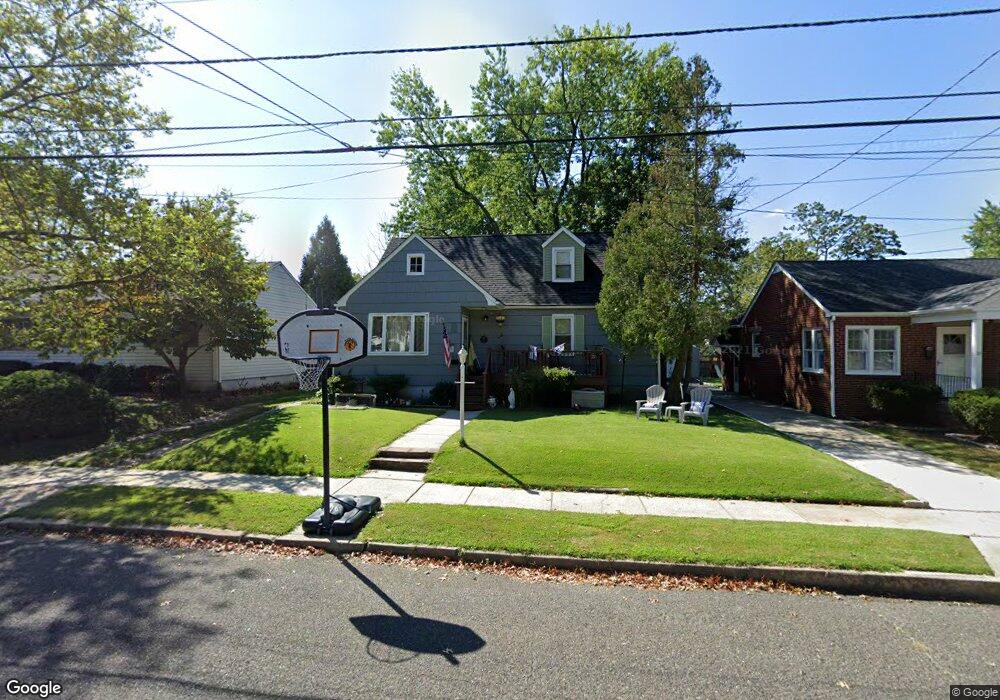
347 Queen St Woodbury, NJ 08096
Estimated Value: $259,041 - $346,000
--
Bed
--
Bath
1,655
Sq Ft
$188/Sq Ft
Est. Value
About This Home
This home is located at 347 Queen St, Woodbury, NJ 08096 and is currently estimated at $311,260, approximately $188 per square foot. 347 Queen St is a home located in Gloucester County with nearby schools including Woodbury Junior/Senior High School, Holy Angels Catholic School, and St Margaret Regional School.
Ownership History
Date
Name
Owned For
Owner Type
Purchase Details
Closed on
Jan 12, 2001
Sold by
Mcnerney Pamela J
Bought by
Nocito Stefano and Nocito Nicole
Current Estimated Value
Home Financials for this Owner
Home Financials are based on the most recent Mortgage that was taken out on this home.
Original Mortgage
$86,275
Outstanding Balance
$31,486
Interest Rate
7.39%
Mortgage Type
FHA
Estimated Equity
$279,774
Purchase Details
Closed on
Sep 9, 1998
Sold by
Kincaid James M
Bought by
Mcnerney Pamela J
Create a Home Valuation Report for This Property
The Home Valuation Report is an in-depth analysis detailing your home's value as well as a comparison with similar homes in the area
Home Values in the Area
Average Home Value in this Area
Purchase History
| Date | Buyer | Sale Price | Title Company |
|---|---|---|---|
| Nocito Stefano | $87,000 | Fidelity National Title Ins | |
| Mcnerney Pamela J | $75,000 | Heritage Title & Abstract Ag |
Source: Public Records
Mortgage History
| Date | Status | Borrower | Loan Amount |
|---|---|---|---|
| Open | Nocito Stefano | $86,275 |
Source: Public Records
Tax History Compared to Growth
Tax History
| Year | Tax Paid | Tax Assessment Tax Assessment Total Assessment is a certain percentage of the fair market value that is determined by local assessors to be the total taxable value of land and additions on the property. | Land | Improvement |
|---|---|---|---|---|
| 2025 | $6,447 | $134,000 | $44,200 | $89,800 |
| 2024 | $6,218 | $134,000 | $44,200 | $89,800 |
| 2023 | $6,218 | $134,000 | $44,200 | $89,800 |
| 2022 | $6,108 | $134,000 | $44,200 | $89,800 |
| 2021 | $6,027 | $134,000 | $44,200 | $89,800 |
| 2020 | $6,726 | $136,200 | $39,200 | $97,000 |
| 2019 | $6,499 | $136,200 | $39,200 | $97,000 |
| 2018 | $6,355 | $136,200 | $39,200 | $97,000 |
| 2017 | $6,247 | $136,200 | $39,200 | $97,000 |
| 2016 | $6,160 | $136,200 | $39,200 | $97,000 |
| 2015 | $6,060 | $136,200 | $39,200 | $97,000 |
| 2014 | $5,964 | $136,200 | $39,200 | $97,000 |
Source: Public Records
Map
Nearby Homes