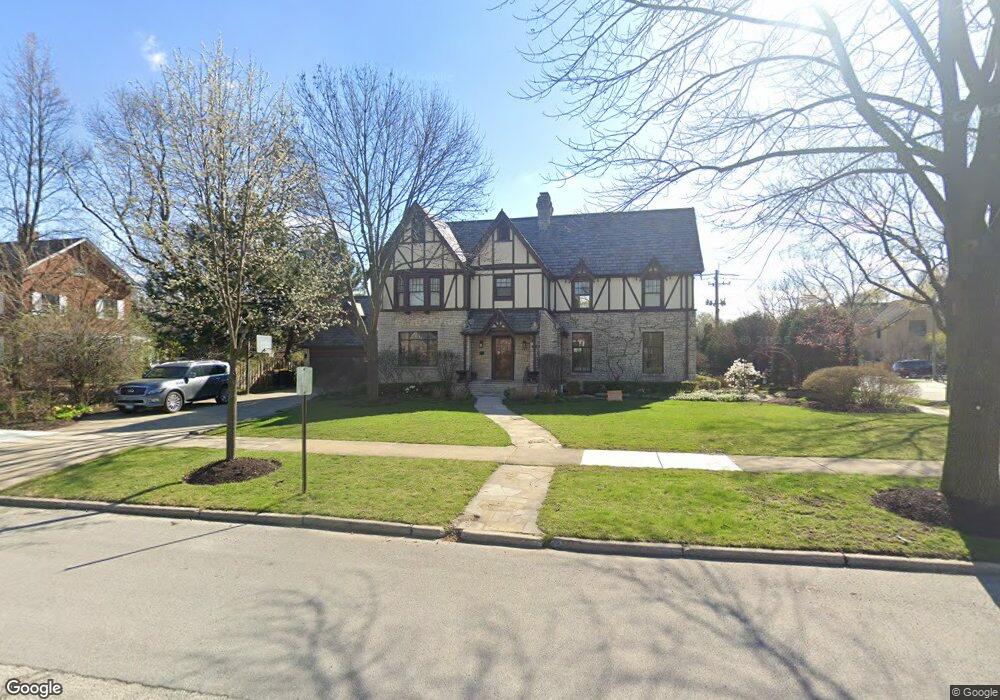
347 S Sunset Ave La Grange, IL 60525
Estimated Value: $1,711,220 - $1,934,000
5
Beds
6
Baths
4,600
Sq Ft
$398/Sq Ft
Est. Value
About This Home
This home is located at 347 S Sunset Ave, La Grange, IL 60525 and is currently estimated at $1,828,805, approximately $397 per square foot. 347 S Sunset Ave is a home located in Cook County with nearby schools including Cossitt Avenue Elementary School, Park Junior High School, and Lyons Township High School.
Ownership History
Date
Name
Owned For
Owner Type
Purchase Details
Closed on
Jun 8, 2021
Sold by
Murphy Laura A and Laura A Murphy Trust
Bought by
Green Joseph and Green Tara
Current Estimated Value
Home Financials for this Owner
Home Financials are based on the most recent Mortgage that was taken out on this home.
Original Mortgage
$1,068,000
Interest Rate
3%
Mortgage Type
New Conventional
Purchase Details
Closed on
Sep 18, 2006
Sold by
Murphy Thomas P and Murphy Laura A
Bought by
Murphy Laura A and Laura A Murphy Trust
Purchase Details
Closed on
Dec 11, 1997
Sold by
Cole Taylor Bank
Bought by
Murphy Thomas P and Murphy Laura A
Home Financials for this Owner
Home Financials are based on the most recent Mortgage that was taken out on this home.
Original Mortgage
$500,000
Interest Rate
7.32%
Create a Home Valuation Report for This Property
The Home Valuation Report is an in-depth analysis detailing your home's value as well as a comparison with similar homes in the area
Home Values in the Area
Average Home Value in this Area
Purchase History
| Date | Buyer | Sale Price | Title Company |
|---|---|---|---|
| Green Joseph | $1,335,000 | First American Title | |
| Murphy Laura A | -- | None Available | |
| Murphy Thomas P | $561,000 | -- |
Source: Public Records
Mortgage History
| Date | Status | Borrower | Loan Amount |
|---|---|---|---|
| Previous Owner | Green Joseph | $1,068,000 | |
| Previous Owner | Murphy Thomas P | $500,000 |
Source: Public Records
Tax History
| Year | Tax Paid | Tax Assessment Tax Assessment Total Assessment is a certain percentage of the fair market value that is determined by local assessors to be the total taxable value of land and additions on the property. | Land | Improvement |
|---|---|---|---|---|
| 2025 | $32,068 | $132,591 | $19,440 | $113,151 |
| 2024 | $32,068 | $132,591 | $19,440 | $113,151 |
| 2023 | $27,534 | $132,591 | $19,440 | $113,151 |
| 2022 | $27,534 | $97,193 | $14,580 | $82,613 |
| 2021 | $26,473 | $97,193 | $14,580 | $82,613 |
| 2020 | $25,974 | $97,193 | $14,580 | $82,613 |
| 2019 | $28,112 | $105,328 | $13,365 | $91,963 |
| 2018 | $27,575 | $105,328 | $13,365 | $91,963 |
| 2017 | $27,604 | $108,145 | $13,365 | $94,780 |
| 2016 | $27,794 | $97,487 | $11,745 | $85,742 |
| 2015 | $25,947 | $97,487 | $11,745 | $85,742 |
| 2014 | $26,879 | $102,414 | $11,745 | $90,669 |
| 2013 | $22,247 | $86,838 | $11,745 | $75,093 |
Source: Public Records
Map
Nearby Homes
- 424 S Edgewood Ave
- 410 Leitch Ave
- 310 Leitch Ave
- 509 S Brainard Ave
- 5608 S Gilbert Ave
- 225 S Stone Ave
- 120 S Stone Ave
- 413 S Kensington Ave
- 17-19 N Brainard Ave
- 711 S Catherine Ave
- 210 Rugeley Rd
- 434 Lagrange Rd
- 36 N Waiola Ave
- 740 S Ashland Ave
- 12 N Kensington Ave
- 4049 Harvey Ave
- 926 S Spring Ave
- 835 S Ashland Ave
- 645 S 6th Ave
- 702 Courtland Cir
- 347 Sunset Ave
- 337 Sunset Ave
- 350 Blackstone Ave
- 401 Sunset Ave
- 340 Blackstone Ave
- 401 S Sunset Ave
- 333 Sunset Ave
- 350 Sunset Ave
- 400 S Blackstone Ave
- 338 Sunset Ave
- 400 Blackstone Ave
- 330 Blackstone Ave
- 405 Sunset Ave
- 400 Sunset Ave
- 330 Sunset Ave
- 410 Blackstone Ave
- 321 Sunset Ave
- 408 Sunset Ave
- 322 Blackstone Ave
- 417 Sunset Ave
Your Personal Tour Guide
Ask me questions while you tour the home.