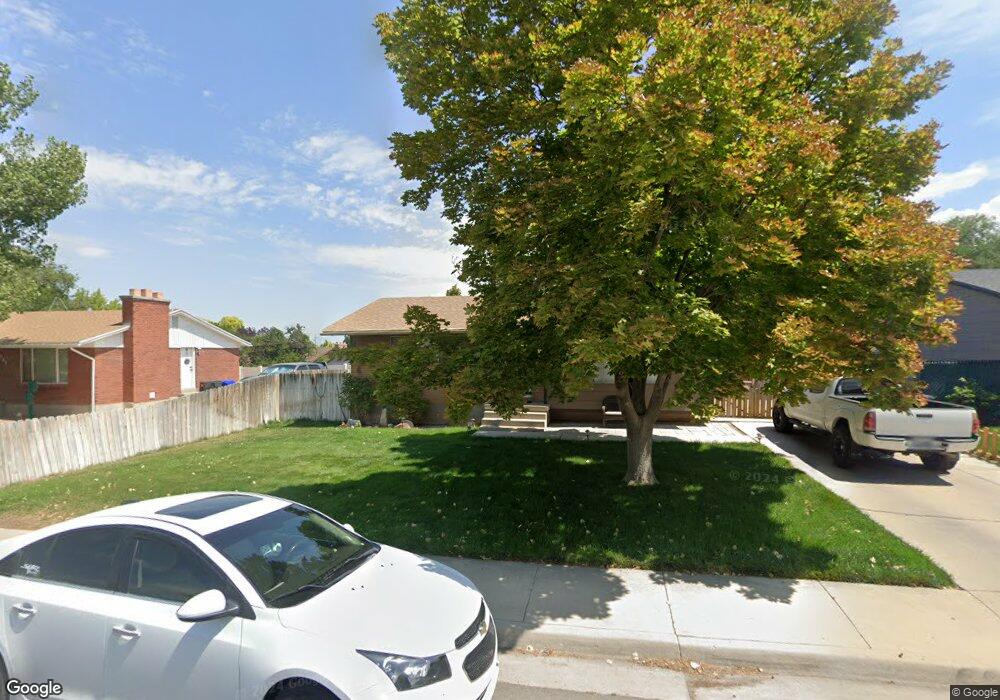
347 Severe St Grantsville, UT 84029
Estimated Value: $368,000 - $393,000
4
Beds
2
Baths
1,900
Sq Ft
$203/Sq Ft
Est. Value
About This Home
This home is located at 347 Severe St, Grantsville, UT 84029 and is currently estimated at $384,821, approximately $202 per square foot. 347 Severe St is a home located in Tooele County with nearby schools including Grantsville Elementary School, Grantsville Junior High School, and Grantsville High School.
Ownership History
Date
Name
Owned For
Owner Type
Purchase Details
Closed on
Sep 6, 2022
Sold by
Rice Stephanie L
Bought by
Rice Stephanie L
Current Estimated Value
Home Financials for this Owner
Home Financials are based on the most recent Mortgage that was taken out on this home.
Original Mortgage
$231,990
Outstanding Balance
$221,728
Interest Rate
5.3%
Mortgage Type
FHA
Estimated Equity
$163,093
Purchase Details
Closed on
Nov 13, 2020
Sold by
Rice Jereme S and Rice Stephanie L
Bought by
Rice Stephanie L
Home Financials for this Owner
Home Financials are based on the most recent Mortgage that was taken out on this home.
Original Mortgage
$192,000
Interest Rate
2.8%
Mortgage Type
New Conventional
Purchase Details
Closed on
Aug 24, 2010
Sold by
Cole Douglas A and Cole Shellece
Bought by
Rice Jereme S and Rice Stephanie
Home Financials for this Owner
Home Financials are based on the most recent Mortgage that was taken out on this home.
Original Mortgage
$168,705
Interest Rate
4.52%
Mortgage Type
New Conventional
Create a Home Valuation Report for This Property
The Home Valuation Report is an in-depth analysis detailing your home's value as well as a comparison with similar homes in the area
Home Values in the Area
Average Home Value in this Area
Purchase History
| Date | Buyer | Sale Price | Title Company |
|---|---|---|---|
| Rice Stephanie L | -- | -- | |
| Rice Stephanie L | -- | Security Title Ins Agcy Of | |
| Rice Jereme S | -- | First American Title Insuran |
Source: Public Records
Mortgage History
| Date | Status | Borrower | Loan Amount |
|---|---|---|---|
| Open | Rice Stephanie L | $231,990 | |
| Previous Owner | Rice Stephanie L | $192,000 | |
| Previous Owner | Rice Jereme S | $168,705 |
Source: Public Records
Tax History Compared to Growth
Tax History
| Year | Tax Paid | Tax Assessment Tax Assessment Total Assessment is a certain percentage of the fair market value that is determined by local assessors to be the total taxable value of land and additions on the property. | Land | Improvement |
|---|---|---|---|---|
| 2025 | $1,650 | $180,692 | $36,960 | $143,732 |
| 2024 | $1,650 | $134,716 | $36,960 | $97,756 |
| 2023 | $1,650 | $150,984 | $38,280 | $112,704 |
| 2022 | $1,900 | $174,805 | $40,062 | $134,743 |
| 2021 | $1,645 | $123,454 | $31,708 | $91,746 |
| 2020 | $1,619 | $213,986 | $57,650 | $156,336 |
| 2019 | $1,516 | $195,626 | $30,000 | $165,626 |
| 2018 | $1,382 | $168,022 | $30,000 | $138,022 |
| 2017 | $1,125 | $145,018 | $30,000 | $115,018 |
| 2016 | $1,072 | $74,009 | $16,500 | $57,509 |
| 2015 | $1,072 | $74,009 | $0 | $0 |
| 2014 | -- | $66,198 | $0 | $0 |
Source: Public Records
Map
Nearby Homes
- 360 Belaire Cir
- 366 Belaire Cir
- 346 W Durfee St
- 256 W Pear St
- 397 S Trejo Ridge Rd
- 239 W Plum St
- 418 S Cardon Ridge Way
- 464 S Trejo Ridge Rd
- 282 W Apple St
- 55 S Cooley St
- 537 W Apple St Unit 3
- 278 S Hale St
- 365 S Hale St
- 405 W Domain Ln
- 1550 Farmhouse Plan at Northstar Ranch
- Portland Plan at Northstar Ranch
- 1425 Craftsman Plan at Northstar Ranch
- 1700 Farmhouse Plan at Northstar Ranch
- 2050 Farmhouse Plan at Northstar Ranch
- 421 W Domain Ln