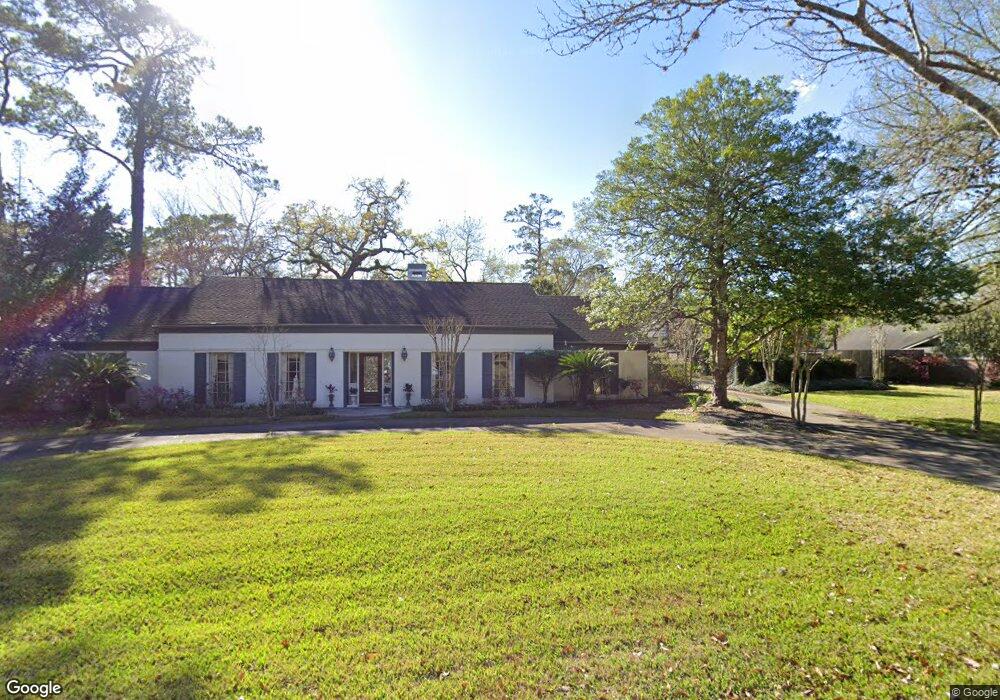
347 Tynebridge Ln Houston, TX 77024
Estimated Value: $2,187,000 - $2,626,000
4
Beds
4
Baths
3,592
Sq Ft
$678/Sq Ft
Est. Value
About This Home
This home is located at 347 Tynebridge Ln, Houston, TX 77024 and is currently estimated at $2,435,879, approximately $678 per square foot. 347 Tynebridge Ln is a home located in Harris County with nearby schools including Memorial Drive Elementary School, Spring Branch Middle School, and Memorial High School.
Ownership History
Date
Name
Owned For
Owner Type
Purchase Details
Closed on
Sep 26, 2025
Sold by
Gold Coast Equity Llc
Bought by
T Hobson Investments Llc
Current Estimated Value
Home Financials for this Owner
Home Financials are based on the most recent Mortgage that was taken out on this home.
Original Mortgage
$2,435,000
Outstanding Balance
$2,435,000
Interest Rate
6.58%
Mortgage Type
Construction
Estimated Equity
$879
Create a Home Valuation Report for This Property
The Home Valuation Report is an in-depth analysis detailing your home's value as well as a comparison with similar homes in the area
Home Values in the Area
Average Home Value in this Area
Purchase History
| Date | Buyer | Sale Price | Title Company |
|---|---|---|---|
| T Hobson Investments Llc | -- | Capital Title | |
| Gold Coast Equity Llc | -- | Capital Title |
Source: Public Records
Mortgage History
| Date | Status | Borrower | Loan Amount |
|---|---|---|---|
| Open | T Hobson Investments Llc | $2,435,000 |
Source: Public Records
Tax History Compared to Growth
Tax History
| Year | Tax Paid | Tax Assessment Tax Assessment Total Assessment is a certain percentage of the fair market value that is determined by local assessors to be the total taxable value of land and additions on the property. | Land | Improvement |
|---|---|---|---|---|
| 2025 | $11,490 | $1,866,700 | $1,527,984 | $338,716 |
| 2024 | $11,490 | $1,759,477 | $1,443,096 | $316,381 |
| 2023 | $11,166 | $1,784,864 | $1,379,430 | $405,434 |
| 2022 | $35,026 | $1,680,000 | $1,273,320 | $406,680 |
| 2021 | $33,437 | $1,550,404 | $1,167,210 | $383,194 |
| 2020 | $31,071 | $1,399,423 | $1,167,210 | $232,213 |
| 2019 | $35,768 | $1,546,891 | $1,167,210 | $379,681 |
| 2018 | $9,041 | $1,503,000 | $1,167,210 | $335,790 |
| 2017 | $35,118 | $1,582,000 | $1,167,210 | $414,790 |
| 2016 | $31,926 | $1,441,000 | $997,434 | $443,566 |
| 2015 | $14,155 | $1,254,900 | $997,434 | $257,466 |
| 2014 | $14,155 | $1,200,000 | $954,990 | $245,010 |
Source: Public Records
Map
Nearby Homes
- 354 Piney Point Rd
- 11305 Green Vale Dr
- 435 Flint Point Dr
- 252 Piney Point Rd
- 220 Merrie Way Ln
- 11323 Iris Lee Ln
- 247 Piney Point Rd
- 11095 Memorial Dr
- 4 Glendenning Ln
- 1 Chuckanut Ln
- 534 Lanecrest Ln
- 534 W Dana Ln
- 11606 Blalock Ln
- 10911 Kemwood Dr
- 11607 Shady Grove Ln
- 570 Lanecrest Ln
- 11640 Greenbay St
- 1010 River Bend Dr
- 2 Wexford Ct
- 918 Huntington Cove
- 343 Tynebridge Ln
- 351 Tynebridge Ln
- 358 Piney Point Rd
- 11302 Jamestown Rd
- 350 Tynebridge Ln
- 342 Tynebridge Ln
- 11301 Jamestown Rd
- 339 Tynebridge Ln
- 355 Tynebridge Ln
- 354 Tynebridge Ln
- 360 Piney Point Rd
- 11218 Lacewood Ln
- 356 Piney Point Rd
- 338 Tynebridge Ln
- 11307 Coloma Ln
- 11306 Jamestown Rd
- 335 Tynebridge Ln
- 11215 Lacewood Ln
- 11219 Montebello Ct
- 354 Piney Point Rd