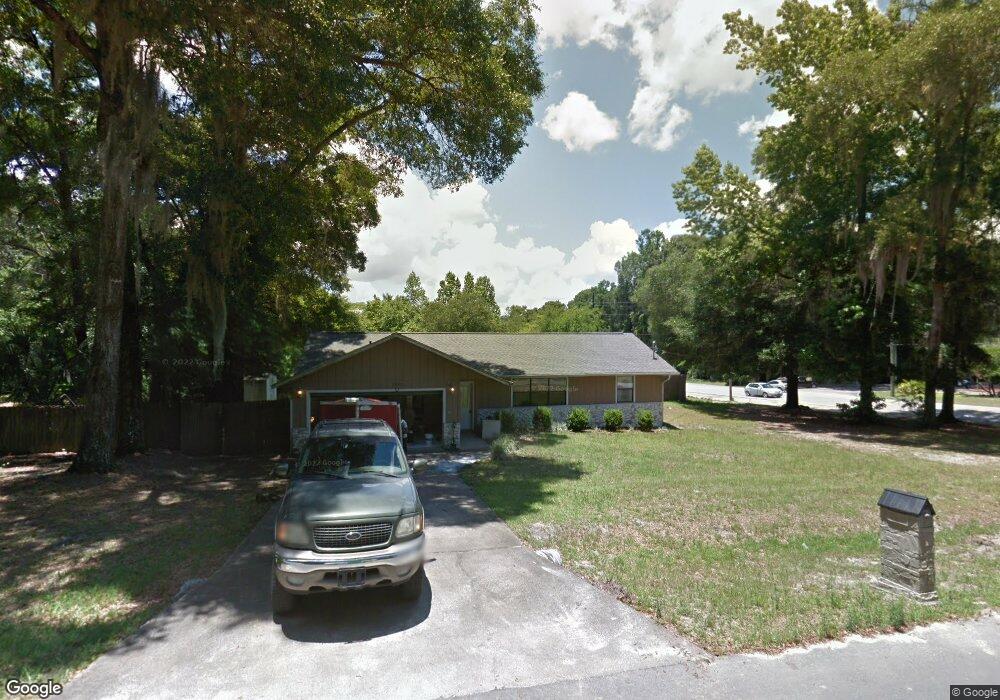
3470 NE 26 Ave Other City - In the State of Florida, FL 34479
Northeast Ocala NeighborhoodEstimated Value: $207,000 - $250,323
3
Beds
3
Baths
1,464
Sq Ft
$159/Sq Ft
Est. Value
About This Home
This home is located at 3470 NE 26 Ave, Other City - In the State of Florida, FL 34479 and is currently estimated at $232,331, approximately $158 per square foot. 3470 NE 26 Ave is a home located in Marion County with nearby schools including Ocala Springs Elementary School, Fort King Middle School, and Vanguard High School.
Ownership History
Date
Name
Owned For
Owner Type
Purchase Details
Closed on
May 1, 2017
Bought by
Zinaich Peter J
Current Estimated Value
Purchase Details
Closed on
Jun 24, 2015
Sold by
Zinaich Betty J
Bought by
Zinaich Betty J and Zinaich Peter J
Purchase Details
Closed on
Jun 19, 2015
Sold by
Zinaich Peter J and Zinaich Martin G
Bought by
Elder Planning Income Concepts
Purchase Details
Closed on
May 15, 2015
Sold by
Santos Mary and Santos Jesus
Bought by
The Seneca Fund Llc
Purchase Details
Closed on
Mar 24, 2005
Sold by
Busler Mae J
Bought by
Santos Mary
Home Financials for this Owner
Home Financials are based on the most recent Mortgage that was taken out on this home.
Original Mortgage
$80,000
Interest Rate
5.74%
Mortgage Type
Purchase Money Mortgage
Create a Home Valuation Report for This Property
The Home Valuation Report is an in-depth analysis detailing your home's value as well as a comparison with similar homes in the area
Home Values in the Area
Average Home Value in this Area
Purchase History
| Date | Buyer | Sale Price | Title Company |
|---|---|---|---|
| Zinaich Peter J | $100 | -- | |
| Zinaich Betty J | -- | Attorney | |
| Zinaich Betty J | $109,300 | Attorney | |
| Elder Planning Income Concepts | $109,300 | None Listed On Document | |
| The Seneca Fund Llc | $75,100 | None Available | |
| Santos Mary | $100,000 | South Coast Title |
Source: Public Records
Mortgage History
| Date | Status | Borrower | Loan Amount |
|---|---|---|---|
| Previous Owner | Santos Mary | $80,000 |
Source: Public Records
Tax History Compared to Growth
Tax History
| Year | Tax Paid | Tax Assessment Tax Assessment Total Assessment is a certain percentage of the fair market value that is determined by local assessors to be the total taxable value of land and additions on the property. | Land | Improvement |
|---|---|---|---|---|
| 2024 | $3,020 | $156,135 | -- | -- |
| 2023 | $2,990 | $141,941 | $0 | $0 |
| 2022 | $2,875 | $129,037 | $0 | $0 |
| 2021 | $2,636 | $138,903 | $35,000 | $103,903 |
| 2020 | $2,326 | $106,642 | $20,000 | $86,642 |
| 2019 | $2,332 | $108,768 | $16,000 | $92,768 |
| 2018 | $2,073 | $94,239 | $14,000 | $80,239 |
| 2017 | $2,011 | $90,108 | $12,000 | $78,108 |
| 2016 | $1,957 | $86,818 | $0 | $0 |
| 2015 | $1,928 | $83,975 | $0 | $0 |
| 2014 | $1,830 | $82,336 | $0 | $0 |
Source: Public Records
Map
Nearby Homes
- 2564 NE 32nd Place
- 2750 NE 32nd Place
- 2313 NE 34th Place
- 2317 NE 36th St
- 2404 NE 32nd Place
- 2312 NE 37th St
- 3922 NE 28th Ct
- 2301 NE 36th St
- 3885 NE 28th Terrace
- 3800 NE 24th Ct
- 2212 NE 36th St
- 3684 NE 30th Terrace
- 3003 NE 24th Ave
- 2912 NE 24th Ct
- 3571 NE 22nd Ave
- 2818 NE 25th Ct
- 2449 NE 40th St
- 3125 NE 38th St
- 3201 NE 38th St
- 3939 NE 31st Ave
- 3470 NE 26th Ave
- 2570 NE 35th St
- 2581 NE 34th St
- 2616 NE 35th St
- 2615 NE 34th St
- 2615 NE 34 St
- 2636 NE 35th St
- 2625 NE 34th St
- 2590 NE 34th St
- 2604 NE 34th St
- 2604 NE 34 St
- 2650 NE 35th St
- 2539 NE 32nd Place
- 2655 NE 34th St
- 3356 NE 26th Ct
- 2650 NE 34th St
- 2676 NE 35th St
- 2571 NE 32nd Place
- 2675 NE 34th St
- 2534 NE 34 St