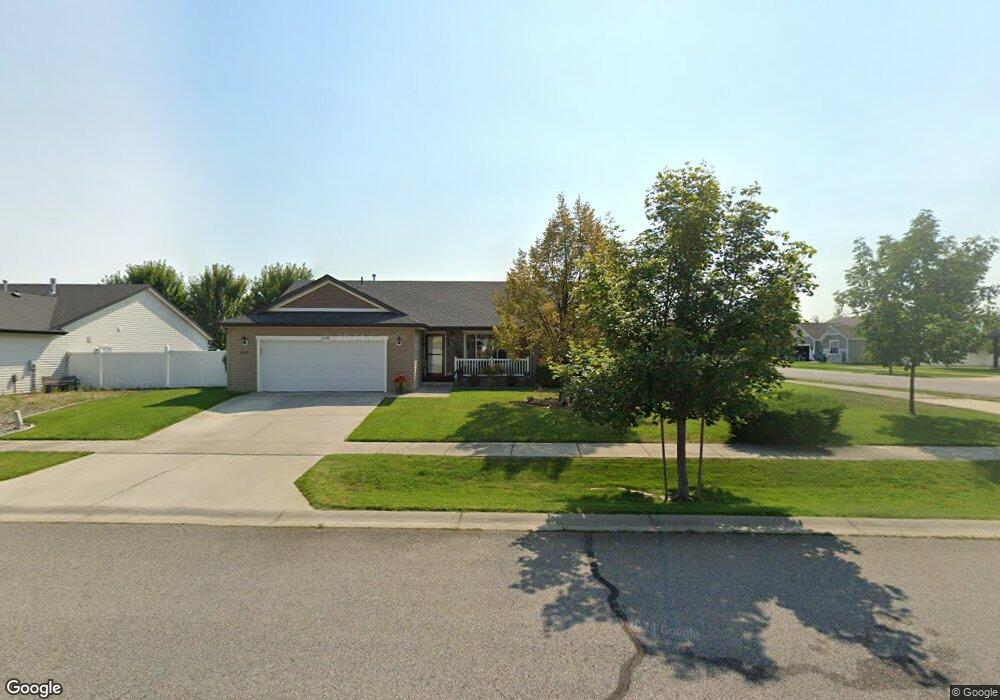
3470 W Parda Dr Coeur D Alene, ID 83815
Atlas-Prairie NeighborhoodEstimated Value: $474,000 - $506,000
3
Beds
2
Baths
1,432
Sq Ft
$346/Sq Ft
Est. Value
About This Home
This home is located at 3470 W Parda Dr, Coeur D Alene, ID 83815 and is currently estimated at $494,842, approximately $345 per square foot. 3470 W Parda Dr is a home located in Kootenai County with nearby schools including Skyway Elementary School, Woodland Middle School, and Lake City High School.
Ownership History
Date
Name
Owned For
Owner Type
Purchase Details
Closed on
Oct 23, 2014
Sold by
Tarver Marlene
Bought by
Kreighbaum Randy M and Kreighbaum Carol A
Current Estimated Value
Home Financials for this Owner
Home Financials are based on the most recent Mortgage that was taken out on this home.
Original Mortgage
$191,442
Outstanding Balance
$144,131
Interest Rate
3.62%
Mortgage Type
FHA
Estimated Equity
$350,711
Purchase Details
Closed on
Jul 2, 2014
Sold by
Edwards Dean M and Edwards Gwendolyn N
Bought by
Tarver Marlene
Purchase Details
Closed on
Sep 11, 2009
Sold by
Hallmark Homes Inc
Bought by
Edwards Dean M and Edwards Gwendolyn N
Home Financials for this Owner
Home Financials are based on the most recent Mortgage that was taken out on this home.
Original Mortgage
$5,985
Interest Rate
5.2%
Mortgage Type
Stand Alone Second
Create a Home Valuation Report for This Property
The Home Valuation Report is an in-depth analysis detailing your home's value as well as a comparison with similar homes in the area
Home Values in the Area
Average Home Value in this Area
Purchase History
| Date | Buyer | Sale Price | Title Company |
|---|---|---|---|
| Kreighbaum Randy M | -- | North Idaho Title Co | |
| Tarver Marlene | -- | Titleone Boise | |
| Edwards Dean M | -- | -- |
Source: Public Records
Mortgage History
| Date | Status | Borrower | Loan Amount |
|---|---|---|---|
| Open | Kreighbaum Randy M | $191,442 | |
| Previous Owner | Edwards Dean M | $5,985 |
Source: Public Records
Tax History Compared to Growth
Tax History
| Year | Tax Paid | Tax Assessment Tax Assessment Total Assessment is a certain percentage of the fair market value that is determined by local assessors to be the total taxable value of land and additions on the property. | Land | Improvement |
|---|---|---|---|---|
| 2025 | $1,628 | $477,121 | $209,000 | $268,121 |
| 2024 | $1,628 | $451,680 | $198,000 | $253,680 |
| 2023 | $1,628 | $478,256 | $198,000 | $280,256 |
| 2022 | $2,133 | $528,790 | $219,542 | $309,248 |
| 2021 | $1,781 | $329,248 | $121,968 | $207,280 |
| 2020 | $1,663 | $285,767 | $101,640 | $184,127 |
| 2019 | $1,841 | $269,849 | $96,800 | $173,049 |
| 2018 | $1,595 | $230,350 | $82,488 | $147,862 |
| 2017 | $1,348 | $199,840 | $68,740 | $131,100 |
| 2016 | $1,310 | $183,834 | $59,774 | $124,060 |
| 2015 | $1,295 | $176,280 | $54,340 | $121,940 |
| 2013 | $1,143 | $140,783 | $32,923 | $107,860 |
Source: Public Records
Map
Nearby Homes
- 6947 N Fast Hawk Ln
- 7096 N Talon Ln
- 3656 W Furcula Dr
- 3828 W Sharpshin Dr
- 3640 W Manning Loop
- 7291 N Grafton St
- 7432 N Talon Ln
- 7374 N Breaux
- 7379 Breaux Dr
- 7322 Breaux Dr
- 6639 N Goshawk Ln
- 7350 N Breaux Dr
- 7336 Breaux Dr
- 7388 Breaux Dr
- 7400 Breaux Dr
- 7414 Breaux Dr
- Roslyn Plan at Coeur d’Alene Place - Bluesky Collection
- Sonoma Plan at Coeur d’Alene Place - Bluesky Collection
- Kingston Plan at Coeur d’Alene Place - Bluesky Collection
- Springfield Plan at Coeur d’Alene Place - Bluesky Collection
- 3444 W Parda Dr
- 3424 W Parda Dr
- 3457 W Ranero Dr
- 3551 Ranero Dr
- 3433 W Ranero Dr
- 7039 N Fast Hawk Ln
- 3471 W Parda Dr
- 3447 W Parda Dr
- 3411 W Ranero Dr
- 7061 N Fast Hawk Ln
- 3404 W Parda Dr
- 7007 Fast Hawk Ln
- 3431 W Parda Dr
- 7085 N Fast Hawk Ln
- 6989 N Fast Hawk Ln
- 3393 W Ranero Dr
- 7097 N Fast Hawk Ln
- 3407 W Parda Dr
- 3380 W Parda Dr
- 6973 N Fast Hawk Ln