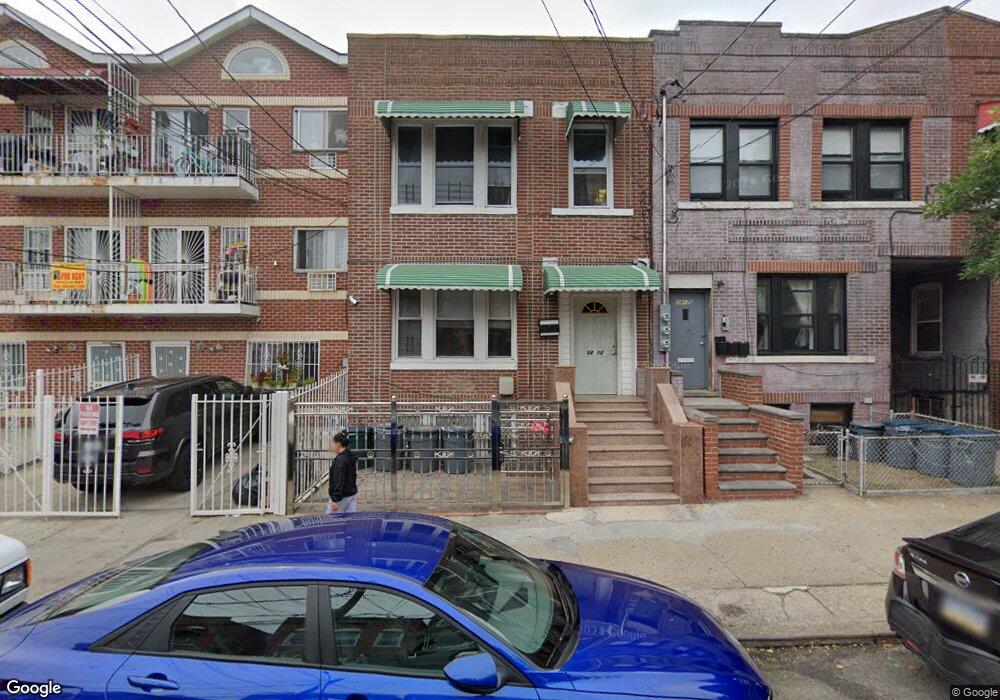
3472 110th St Corona, NY 11368
Corona NeighborhoodEstimated Value: $1,132,000 - $1,346,000
--
Bed
--
Bath
3,112
Sq Ft
$396/Sq Ft
Est. Value
About This Home
This home is located at 3472 110th St, Corona, NY 11368 and is currently estimated at $1,232,667, approximately $396 per square foot. 3472 110th St is a home located in Queens County with nearby schools including P.S. 143 Louis Armstrong, Is 61 Leonardo Da Vinci, and Flushing High School.
Ownership History
Date
Name
Owned For
Owner Type
Purchase Details
Closed on
Dec 24, 2014
Sold by
Delaguarda Ambiores
Bought by
Delaguarda Juan A and Delaguarda Miguel F
Current Estimated Value
Home Financials for this Owner
Home Financials are based on the most recent Mortgage that was taken out on this home.
Original Mortgage
$266,306
Outstanding Balance
$203,988
Interest Rate
3.92%
Mortgage Type
New Conventional
Estimated Equity
$1,028,679
Purchase Details
Closed on
Dec 21, 2000
Sold by
Hud
Bought by
Delaguarda Juan A and Delaguarda Felix
Home Financials for this Owner
Home Financials are based on the most recent Mortgage that was taken out on this home.
Original Mortgage
$334,500
Interest Rate
7.64%
Mortgage Type
FHA
Purchase Details
Closed on
Dec 22, 1994
Sold by
The Green Point Svgs Bank
Bought by
Jardine Verde Realty Corp
Create a Home Valuation Report for This Property
The Home Valuation Report is an in-depth analysis detailing your home's value as well as a comparison with similar homes in the area
Home Values in the Area
Average Home Value in this Area
Purchase History
| Date | Buyer | Sale Price | Title Company |
|---|---|---|---|
| Delaguarda Juan A | -- | -- | |
| Delaguarda Juan A | $321,700 | Fidelity National Title Ins | |
| Jardine Verde Realty Corp | $143,000 | Ticor Title Guarantee Compan |
Source: Public Records
Mortgage History
| Date | Status | Borrower | Loan Amount |
|---|---|---|---|
| Open | Delaguarda Juan A | $266,306 | |
| Previous Owner | Delaguarda Juan A | $334,500 |
Source: Public Records
Tax History Compared to Growth
Tax History
| Year | Tax Paid | Tax Assessment Tax Assessment Total Assessment is a certain percentage of the fair market value that is determined by local assessors to be the total taxable value of land and additions on the property. | Land | Improvement |
|---|---|---|---|---|
| 2025 | $9,795 | $51,695 | $6,225 | $45,470 |
| 2024 | $9,795 | $48,769 | $5,516 | $43,253 |
| 2023 | $9,795 | $48,769 | $5,210 | $43,559 |
| 2022 | $9,663 | $84,900 | $9,840 | $75,060 |
| 2021 | $9,610 | $86,580 | $9,840 | $76,740 |
| 2020 | $9,119 | $78,180 | $9,840 | $68,340 |
| 2019 | $8,502 | $72,240 | $9,840 | $62,400 |
| 2018 | $7,987 | $40,641 | $7,759 | $32,882 |
| 2017 | $7,923 | $40,335 | $7,989 | $32,346 |
| 2016 | $7,297 | $40,335 | $7,989 | $32,346 |
| 2015 | $4,370 | $35,900 | $8,387 | $27,513 |
| 2014 | $4,370 | $33,868 | $9,498 | $24,370 |
Source: Public Records
Map
Nearby Homes
- 37-17 111th St Unit 5B
- 37-17 111th St Unit 2D
- 108-13 37th Ave
- 37-45 108th St
- 3517 109th St
- 108-20 38th Ave
- 111-15 37th Ave
- 34-49 110th St
- 34-64 111th St
- 108-22 38th Ave
- 35-14 109th St
- 34-36 110th St
- 34-37 110th St
- 107-16 37th Ave Unit 4B
- 107-16 37th Ave Unit 3B
- 10810 35th Ave
- 37-33 107th St Unit 4A
- 37-33 107th St Unit 2A
- 108-14 35th Ave
- 112-01 38th Ave