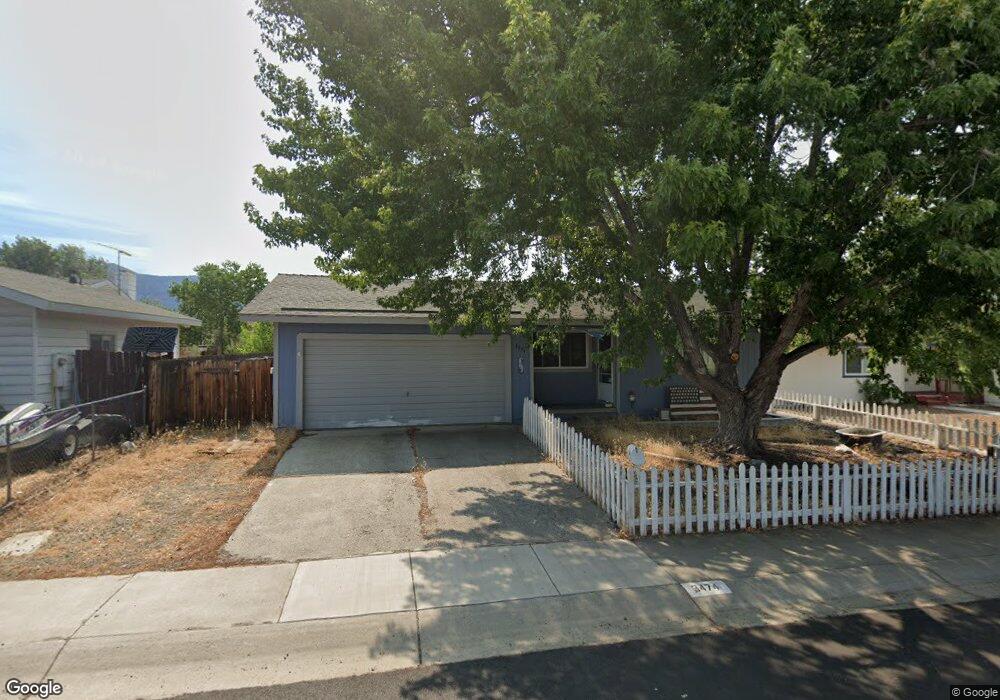
3474 Indian Dr Carson City, NV 89705
Estimated Value: $385,000 - $427,000
3
Beds
2
Baths
1,096
Sq Ft
$368/Sq Ft
Est. Value
About This Home
This home is located at 3474 Indian Dr, Carson City, NV 89705 and is currently estimated at $403,552, approximately $368 per square foot. 3474 Indian Dr is a home located in Douglas County with nearby schools including Jacks Valley Elementary School, Carson Valley Middle School, and Douglas County High School.
Ownership History
Date
Name
Owned For
Owner Type
Purchase Details
Closed on
Aug 3, 2022
Sold by
Joe Vicondoa Tommy
Bought by
2022 Tommy Joe Vicondoa Revocable Trust
Current Estimated Value
Purchase Details
Closed on
Jul 23, 2020
Sold by
Vicondoa Tommy Joe
Bought by
Vicondoa Tommy Joe
Home Financials for this Owner
Home Financials are based on the most recent Mortgage that was taken out on this home.
Original Mortgage
$80,000
Interest Rate
3.2%
Mortgage Type
New Conventional
Purchase Details
Closed on
Jul 30, 2019
Sold by
Vicondoa Pamela Jane
Bought by
Vicondoa Tommy Joe
Purchase Details
Closed on
Dec 7, 2005
Sold by
Moshi Anwya and Moshi Guadalupe
Bought by
Vicondoa Tommy Joe
Home Financials for this Owner
Home Financials are based on the most recent Mortgage that was taken out on this home.
Original Mortgage
$112,000
Interest Rate
6.31%
Mortgage Type
New Conventional
Create a Home Valuation Report for This Property
The Home Valuation Report is an in-depth analysis detailing your home's value as well as a comparison with similar homes in the area
Home Values in the Area
Average Home Value in this Area
Purchase History
| Date | Buyer | Sale Price | Title Company |
|---|---|---|---|
| 2022 Tommy Joe Vicondoa Revocable Trust | -- | -- | |
| Vicondoa Tommy Joe | -- | Etrco | |
| Vicondoa Tommy Joe | -- | None Available | |
| Vicondoa Tommy Joe | $252,000 | First Centennial Title |
Source: Public Records
Mortgage History
| Date | Status | Borrower | Loan Amount |
|---|---|---|---|
| Previous Owner | Vicondoa Tommy Joe | $80,000 | |
| Previous Owner | Vicondoa Tommy Joe | $112,000 |
Source: Public Records
Tax History
| Year | Tax Paid | Tax Assessment Tax Assessment Total Assessment is a certain percentage of the fair market value that is determined by local assessors to be the total taxable value of land and additions on the property. | Land | Improvement |
|---|---|---|---|---|
| 2026 | $1,641 | $50,891 | $31,500 | $19,391 |
| 2025 | $1,667 | $44,846 | $24,500 | $20,346 |
| 2024 | $1,667 | $45,551 | $24,500 | $21,051 |
| 2023 | $1,543 | $43,049 | $22,750 | $20,299 |
| 2022 | $1,429 | $40,504 | $21,000 | $19,504 |
| 2021 | $1,323 | $38,172 | $19,250 | $18,922 |
| 2020 | $1,279 | $38,287 | $19,250 | $19,037 |
| 2019 | $1,235 | $34,913 | $15,750 | $19,163 |
| 2018 | $1,178 | $32,747 | $14,000 | $18,747 |
| 2017 | $1,131 | $31,499 | $12,250 | $19,249 |
| 2016 | $1,102 | $30,394 | $10,500 | $19,894 |
| 2015 | $1,106 | $30,394 | $10,500 | $19,894 |
| 2014 | $1,072 | $29,513 | $10,500 | $19,013 |
Source: Public Records
Map
Nearby Homes
- 3480 Indian Dr
- 907 Garnet Ct
- 3455 Carnelian Way
- 967 Mica Dr
- 3528 Tourmaline Ct
- 3532 Haystack Dr
- 973 Sunview Dr
- 3482 Calcite Cir
- 864 Tourmaline Dr
- 3565 Vista Grande Blvd Unit 2
- 920 Ruby Ct
- 3574 Haystack Dr
- 982 Ridgeview Dr
- 888 Vista Park Dr
- 3645 Vista Grande Blvd
- 997 Ridgeview Dr
- 3500 Green Acre Dr
- 3365 Vista Grande Blvd
- 1023 Ridgeview Ct
- APN 1420-06-701-001
- 3476 Indian Dr
- 3472 Indian Dr
- 3478 Indian Dr
- 3470 Indian Dr
- 915 Garnet Ct
- 3475 Indian Dr
- 3476 Vista Grande Blvd
- 3473 Indian Dr
- 3468 Indian Dr
- 3470 Vista Grande Blvd
- 925 Azurite Ln
- 3471 E Garden St Unit 40
- 3471 Indian Dr
- 3473 E Garden St Unit 41
- 3482 Indian Dr
- 3469 E Garden St Unit 39
- 3475 E Garden St
- 3466 Indian Dr
- 926 Azurite Ln
- 3467 E Garden St Unit 38
Your Personal Tour Guide
Ask me questions while you tour the home.