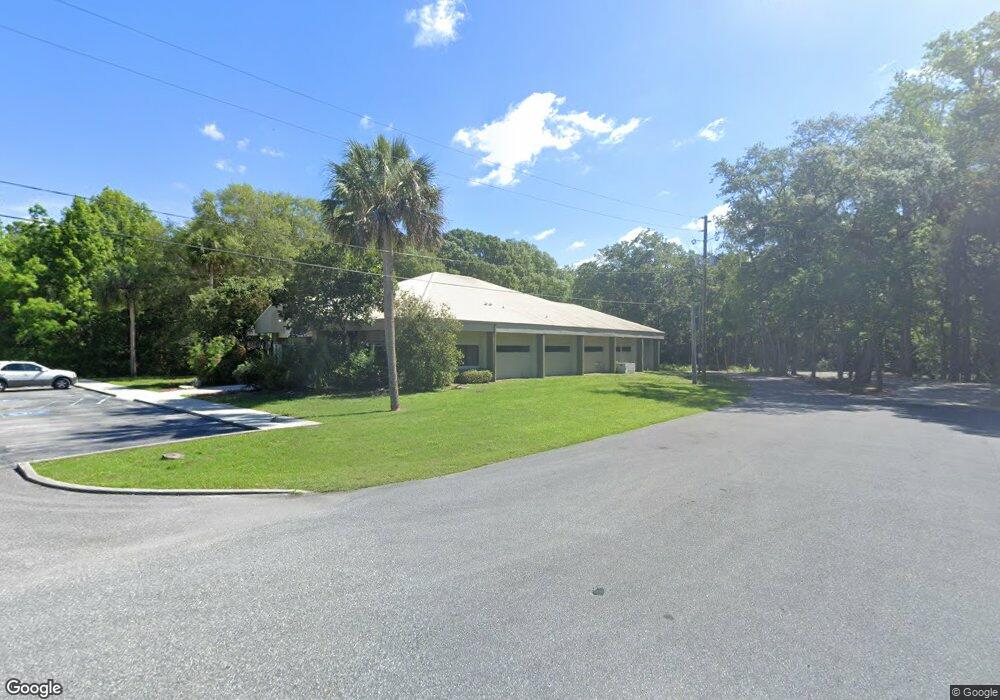
3475 S Suncoast Blvd Homosassa, FL 34448
Estimated Value: $1,466,690
--
Bed
1
Bath
6,230
Sq Ft
$235/Sq Ft
Est. Value
About This Home
This home is located at 3475 S Suncoast Blvd, Homosassa, FL 34448 and is currently estimated at $1,466,690, approximately $235 per square foot. 3475 S Suncoast Blvd is a home located in Citrus County with nearby schools including Homosassa Elementary School, Crystal River High School, and Crystal River Middle School.
Ownership History
Date
Name
Owned For
Owner Type
Purchase Details
Closed on
Dec 16, 2021
Sold by
Desai P G
Bought by
Citrus Multi-Specialty Llc
Current Estimated Value
Home Financials for this Owner
Home Financials are based on the most recent Mortgage that was taken out on this home.
Original Mortgage
$999,500
Outstanding Balance
$856,126
Interest Rate
3.11%
Mortgage Type
New Conventional
Estimated Equity
$610,564
Purchase Details
Closed on
Dec 6, 2021
Sold by
D & I Partners
Bought by
Iyer Desai P and Iyer Hari
Home Financials for this Owner
Home Financials are based on the most recent Mortgage that was taken out on this home.
Original Mortgage
$999,500
Outstanding Balance
$856,126
Interest Rate
3.11%
Mortgage Type
New Conventional
Estimated Equity
$610,564
Purchase Details
Closed on
Feb 1, 1988
Bought by
D & I Partners
Purchase Details
Closed on
May 1, 1979
Bought by
D & I Partners
Create a Home Valuation Report for This Property
The Home Valuation Report is an in-depth analysis detailing your home's value as well as a comparison with similar homes in the area
Home Values in the Area
Average Home Value in this Area
Purchase History
| Date | Buyer | Sale Price | Title Company |
|---|---|---|---|
| Citrus Multi-Specialty Llc | $1,250,000 | Land Title Services | |
| Iyer Desai P | $100 | Land Title Services | |
| D & I Partners | $142,000 | -- | |
| D & I Partners | $100 | -- |
Source: Public Records
Mortgage History
| Date | Status | Borrower | Loan Amount |
|---|---|---|---|
| Open | Citrus Multi-Specialty Llc | $999,500 |
Source: Public Records
Tax History Compared to Growth
Tax History
| Year | Tax Paid | Tax Assessment Tax Assessment Total Assessment is a certain percentage of the fair market value that is determined by local assessors to be the total taxable value of land and additions on the property. | Land | Improvement |
|---|---|---|---|---|
| 2024 | $11,467 | $675,190 | $160,530 | $514,660 |
| 2023 | $11,467 | $661,830 | $160,530 | $501,300 |
| 2022 | $10,272 | $608,990 | $160,530 | $448,460 |
| 2021 | $9,235 | $548,810 | $158,200 | $390,610 |
| 2020 | $9,125 | $546,909 | $158,200 | $388,709 |
| 2019 | $9,551 | $566,282 | $158,200 | $408,082 |
| 2018 | $9,671 | $569,718 | $158,200 | $411,518 |
| 2017 | $10,208 | $588,621 | $158,200 | $430,421 |
| 2016 | $10,571 | $588,800 | $158,200 | $430,600 |
| 2015 | $10,406 | $580,630 | $158,200 | $422,430 |
| 2014 | $10,856 | $587,020 | $177,977 | $409,043 |
Source: Public Records
Map
Nearby Homes
- 3409 S Suncoast Blvd
- 8696 W Faust Ln
- 3404 S Michigan Blvd
- 8733 W Elkhorn Dr
- 3386 S Indiana Ave
- 3411 S Michigan Blvd
- 3919 S Illinois Terrace
- 8145 W Fern Place
- 8107 W Mayfair Dr
- 3834 S Centennial Ave
- 3740 S Eastpark Way
- 13281 W Homosassa Trail
- 3856 S Centennial Ave
- 8275 W Windhaven Place
- 8118 W Windhaven Place
- 8178 W Windhaven Place
- 8975 W Halls River Rd Unit 152
- 8975 W Halls River Rd Unit 243
- 8975 W Halls River Rd
- 8975 W Halls River Rd Unit 218
- 3538 S Suncoast Blvd
- 3540 S Suncoast Blvd
- 3544 S Suncoast Blvd
- 3546 S Suncoast Blvd
- 3548 S Suncoast Blvd
- 8492 W Ivy Place
- 3550 S Suncoast Blvd
- 3366 S Canadian Way
- 3352 S Canadian Way
- 3328 S Canadian Way
- 8423 W Faust Ln
- 3655 S Suncoast Blvd
- 3290 S Canadian Way
- 3685 S Pittsburgh Ave
- 3297 S Suncoast Blvd
- 3581 S Chicago Terrace
- 3660 S Ohio Ave
- 8699 W Faust
- 8609 W Elkhorn Dr
- 3291 S Suncoast Blvd