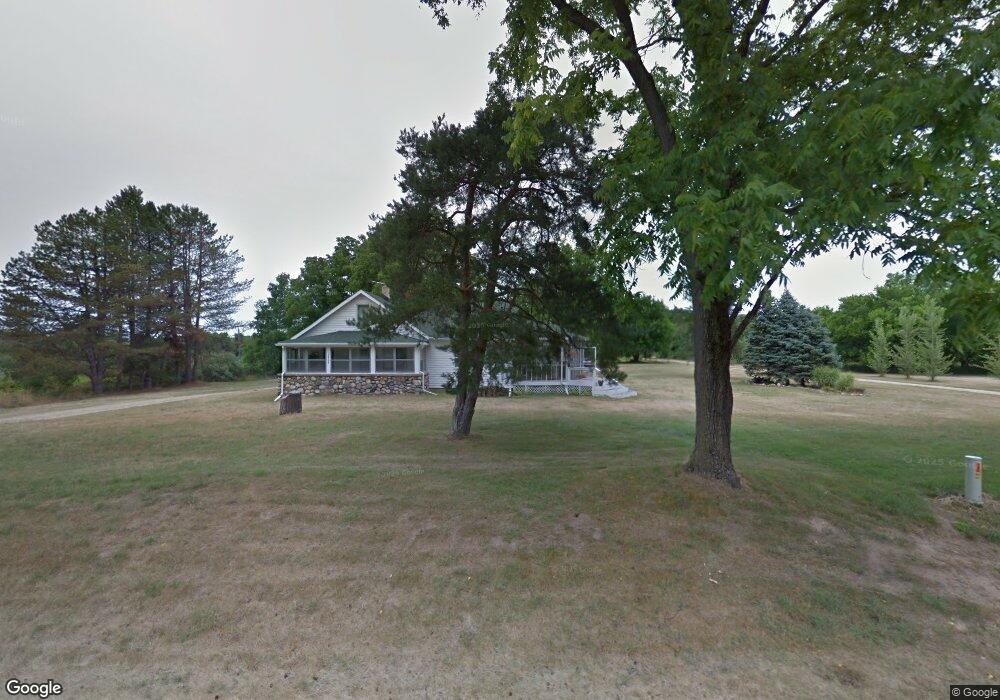
34778 36th Ave Paw Paw, MI 49079
Estimated Value: $263,606 - $505,000
3
Beds
2
Baths
2,025
Sq Ft
$181/Sq Ft
Est. Value
About This Home
This home is located at 34778 36th Ave, Paw Paw, MI 49079 and is currently estimated at $367,535, approximately $181 per square foot. 34778 36th Ave is a home located in Van Buren County with nearby schools including Paw Paw Early Elementary School, Paw Paw Later Elementary School, and Paw Paw Middle School.
Ownership History
Date
Name
Owned For
Owner Type
Purchase Details
Closed on
May 1, 2009
Sold by
Drake Thomas L and Mcintosh Mary Houppert
Bought by
Dunn Brenton E
Current Estimated Value
Home Financials for this Owner
Home Financials are based on the most recent Mortgage that was taken out on this home.
Original Mortgage
$126,428
Outstanding Balance
$79,880
Interest Rate
4.85%
Mortgage Type
Unknown
Estimated Equity
$287,655
Purchase Details
Closed on
Dec 29, 1997
Sold by
Bain Joseph T and Bain Denise
Bought by
Drake Thomas L
Create a Home Valuation Report for This Property
The Home Valuation Report is an in-depth analysis detailing your home's value as well as a comparison with similar homes in the area
Home Values in the Area
Average Home Value in this Area
Purchase History
| Date | Buyer | Sale Price | Title Company |
|---|---|---|---|
| Dunn Brenton E | -- | None Available | |
| Drake Thomas L | -- | -- |
Source: Public Records
Mortgage History
| Date | Status | Borrower | Loan Amount |
|---|---|---|---|
| Open | Dunn Brenton E | $126,428 |
Source: Public Records
Tax History Compared to Growth
Tax History
| Year | Tax Paid | Tax Assessment Tax Assessment Total Assessment is a certain percentage of the fair market value that is determined by local assessors to be the total taxable value of land and additions on the property. | Land | Improvement |
|---|---|---|---|---|
| 2025 | $867 | $116,500 | $0 | $0 |
| 2024 | $867 | $106,600 | $0 | $0 |
| 2023 | $826 | $100,600 | $0 | $0 |
| 2022 | $2,594 | $96,000 | $0 | $0 |
| 2021 | $2,517 | $88,100 | $8,500 | $79,600 |
| 2020 | $2,502 | $88,100 | $8,500 | $79,600 |
| 2019 | $2,382 | $86,100 | $86,100 | $0 |
| 2018 | $2,322 | $79,000 | $79,000 | $0 |
| 2017 | $2,271 | $68,000 | $0 | $0 |
| 2016 | $2,245 | $77,100 | $0 | $0 |
| 2015 | $1,952 | $77,100 | $0 | $0 |
| 2014 | $1,917 | $67,800 | $0 | $0 |
| 2013 | -- | $66,900 | $66,900 | $0 |
Source: Public Records
Map
Nearby Homes