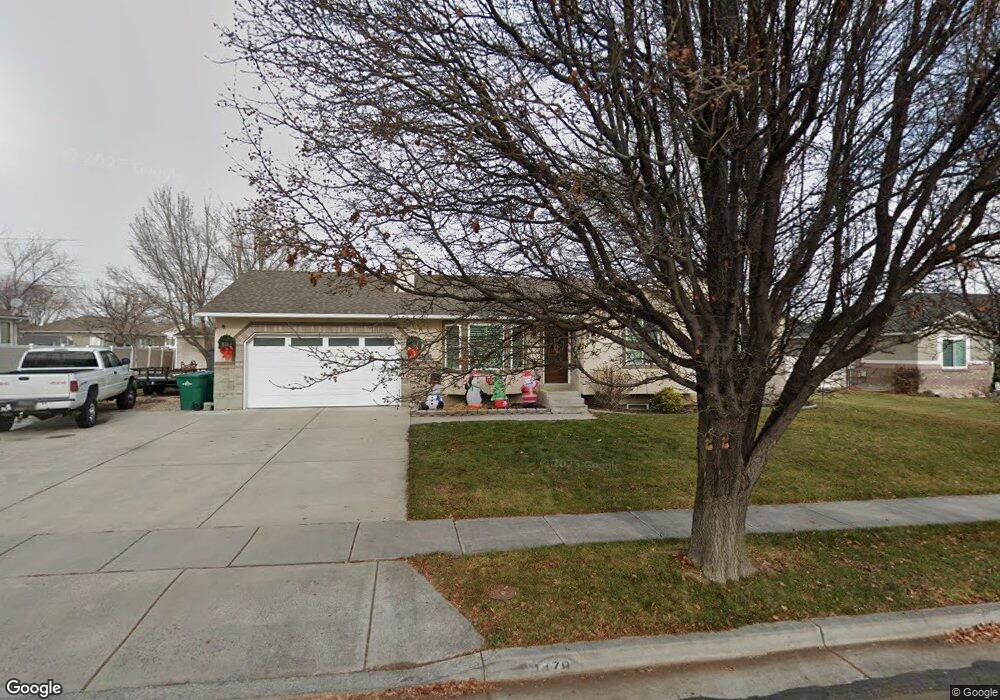
3478 Golden Creek Cir Riverton, UT 84065
Estimated Value: $607,000 - $765,000
4
Beds
2
Baths
2,756
Sq Ft
$239/Sq Ft
Est. Value
About This Home
This home is located at 3478 Golden Creek Cir, Riverton, UT 84065 and is currently estimated at $657,706, approximately $238 per square foot. 3478 Golden Creek Cir is a home located in Salt Lake County with nearby schools including Rose Creek School, Oquirrh Hills Middle School, and Riverton High School.
Ownership History
Date
Name
Owned For
Owner Type
Purchase Details
Closed on
Mar 21, 2002
Sold by
Turpin Steve R and Turpin Christine F
Bought by
Hardy Scott H and Hardy Debra L
Current Estimated Value
Home Financials for this Owner
Home Financials are based on the most recent Mortgage that was taken out on this home.
Original Mortgage
$152,915
Outstanding Balance
$62,932
Interest Rate
6.85%
Estimated Equity
$594,774
Purchase Details
Closed on
Jun 30, 1999
Sold by
Dansie Kenneth L
Bought by
Turpin Steve R and Turpin Christine F
Home Financials for this Owner
Home Financials are based on the most recent Mortgage that was taken out on this home.
Original Mortgage
$139,150
Interest Rate
7.24%
Purchase Details
Closed on
Dec 9, 1998
Sold by
Midas Creek Estates Llc
Bought by
Mccullough Construction Inc
Purchase Details
Closed on
Oct 21, 1998
Sold by
Midas Creek Estates L L C
Bought by
Dansie Kenneth L
Create a Home Valuation Report for This Property
The Home Valuation Report is an in-depth analysis detailing your home's value as well as a comparison with similar homes in the area
Home Values in the Area
Average Home Value in this Area
Purchase History
| Date | Buyer | Sale Price | Title Company |
|---|---|---|---|
| Hardy Scott H | -- | Equity Title | |
| Turpin Steve R | -- | Merrill Title | |
| Mccullough Construction Inc | -- | Surety Title | |
| Dansie Kenneth L | -- | Surety Title Agency |
Source: Public Records
Mortgage History
| Date | Status | Borrower | Loan Amount |
|---|---|---|---|
| Open | Hardy Scott H | $152,915 | |
| Previous Owner | Turpin Steve R | $139,150 |
Source: Public Records
Tax History Compared to Growth
Tax History
| Year | Tax Paid | Tax Assessment Tax Assessment Total Assessment is a certain percentage of the fair market value that is determined by local assessors to be the total taxable value of land and additions on the property. | Land | Improvement |
|---|---|---|---|---|
| 2025 | $3,268 | $585,600 | $207,600 | $378,000 |
| 2024 | $3,268 | $565,600 | $199,600 | $366,000 |
| 2023 | $3,329 | $543,200 | $192,000 | $351,200 |
| 2022 | $3,459 | $553,600 | $188,200 | $365,400 |
| 2021 | $2,972 | $423,600 | $144,500 | $279,100 |
| 2020 | $2,757 | $366,300 | $144,500 | $221,800 |
| 2019 | $2,770 | $361,800 | $140,200 | $221,600 |
| 2018 | $2,608 | $335,400 | $137,300 | $198,100 |
| 2017 | $2,496 | $312,800 | $137,300 | $175,500 |
| 2016 | $2,410 | $289,800 | $137,300 | $152,500 |
| 2015 | $2,559 | $298,400 | $139,900 | $158,500 |
| 2014 | $2,466 | $281,900 | $133,400 | $148,500 |
Source: Public Records
Map
Nearby Homes
- 3376 W Water Crescent Place
- 3644 W Harvest Gold Way
- 11881 S Harvest Gold Way
- 3636 W Harvest Gold Way
- 11882 S Harvest Gold Way
- 3622 W Harvest Gold Way
- 3371 W Waterbridge Cove Unit 417
- 11817 S 3700 W
- 11527 S 3600 W
- 3537 W Sojo Dr
- 3168 Chalk Creek Way
- 3550 W Franco Court #2
- 3312 W Country Bluff Rd
- 12191 S 3600 W
- 3407 W Pazos Cir Unit 4
- 11293 S Sweet Pea Ln
- 11287 S Winter Bluff Ln
- 4056 W Sullivan Rd
- 3558 W Via Bello Ct
- 3792 Lilac Heights Dr
- 3467 Golden Creek Cir
- 3498 Golden Creek Cir
- 3498 W Golden Creek Cir
- 3464 Golden Creek Cir
- 3464 W Golden Creek Cir
- 3481 W Golden Creek Cir
- 3481 Golden Creek Cir
- 3461 W Golden Creek Cir
- 3461 Golden Creek Cir
- 11788 S Monument Cir
- 11788 Monument Cir
- 3501 W Golden Creek Cir
- 3501 Golden Creek Cir
- 11793 S Anthem Ct Unit 317
- 11793 S Anthem Ct
- 3504 Myers Ln
- 3516 Golden Creek Cir
- 11940 Janice Dr
- 11789 Monument Cir
- 11789 S Monument Cir Unit 211