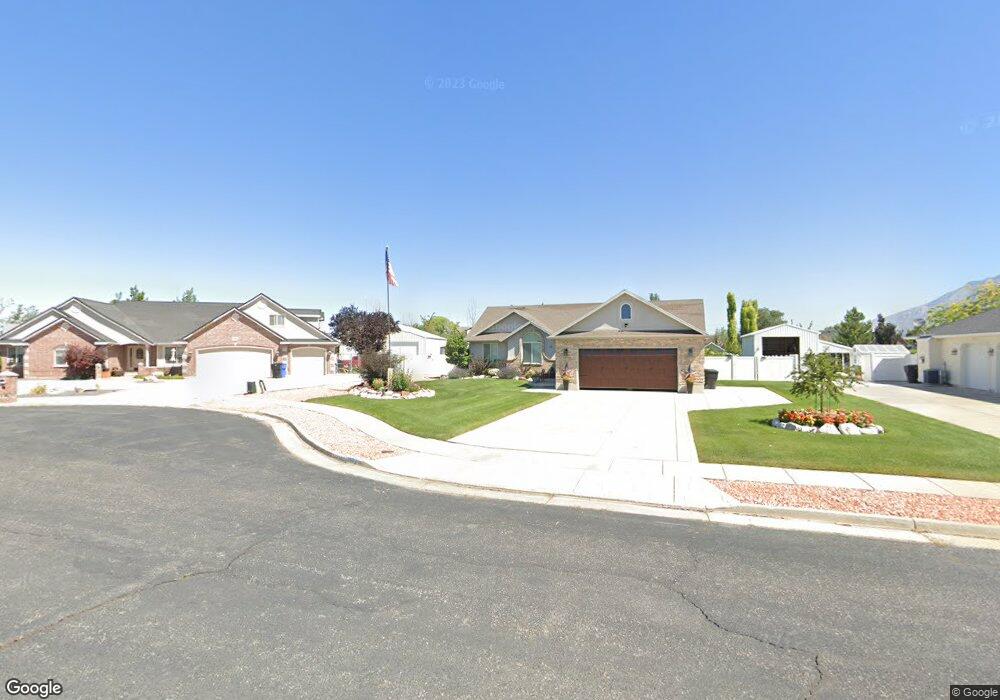
3478 W 2500 N Plain City, UT 84404
Estimated Value: $549,000 - $611,000
3
Beds
2
Baths
1,638
Sq Ft
$348/Sq Ft
Est. Value
About This Home
This home is located at 3478 W 2500 N, Plain City, UT 84404 and is currently estimated at $569,800, approximately $347 per square foot. 3478 W 2500 N is a home located in Weber County with nearby schools including Plain City School, Wahlquist Junior High School, and Fremont High School.
Ownership History
Date
Name
Owned For
Owner Type
Purchase Details
Closed on
Oct 31, 2016
Sold by
Peterson Brucea A and Peterson Diane
Bought by
Peterson Bruce A and Peterson Diane
Current Estimated Value
Purchase Details
Closed on
Apr 3, 2003
Sold by
Dunn Joseph and Dunn David
Bought by
Sharpe Gerald N and Sharpe Linda G
Home Financials for this Owner
Home Financials are based on the most recent Mortgage that was taken out on this home.
Original Mortgage
$152,100
Outstanding Balance
$79,156
Interest Rate
8.7%
Mortgage Type
Purchase Money Mortgage
Estimated Equity
$490,644
Purchase Details
Closed on
Mar 23, 2001
Sold by
Dunn Joseph A and Dunn Amber D
Bought by
Dunn Joseph and Dunn David
Home Financials for this Owner
Home Financials are based on the most recent Mortgage that was taken out on this home.
Original Mortgage
$153,000
Interest Rate
7.06%
Purchase Details
Closed on
May 25, 2000
Sold by
Foxrun Development Lc
Bought by
Dunn Joseph A and Dunn Amber D
Create a Home Valuation Report for This Property
The Home Valuation Report is an in-depth analysis detailing your home's value as well as a comparison with similar homes in the area
Home Values in the Area
Average Home Value in this Area
Purchase History
| Date | Buyer | Sale Price | Title Company |
|---|---|---|---|
| Peterson Bruce A | -- | None Available | |
| Sharpe Gerald N | -- | Bonneville Title | |
| Dunn Joseph | -- | Bonneville Title | |
| Dunn Joseph A | -- | Inwest Title |
Source: Public Records
Mortgage History
| Date | Status | Borrower | Loan Amount |
|---|---|---|---|
| Open | Sharpe Gerald N | $152,100 | |
| Previous Owner | Dunn Joseph | $153,000 |
Source: Public Records
Tax History Compared to Growth
Tax History
| Year | Tax Paid | Tax Assessment Tax Assessment Total Assessment is a certain percentage of the fair market value that is determined by local assessors to be the total taxable value of land and additions on the property. | Land | Improvement |
|---|---|---|---|---|
| 2025 | $446 | $513,898 | $190,000 | $323,898 |
| 2024 | $407 | $278,298 | $104,500 | $173,798 |
| 2023 | $371 | $267,851 | $98,935 | $168,916 |
| 2022 | $1,201 | $336,600 | $93,501 | $243,099 |
| 2021 | $561 | $427,999 | $100,095 | $327,904 |
| 2020 | $325 | $368,000 | $75,004 | $292,996 |
| 2019 | $325 | $333,999 | $65,011 | $268,988 |
| 2018 | $321 | $326,000 | $65,011 | $260,989 |
| 2017 | $317 | $261,001 | $58,991 | $202,010 |
| 2016 | $307 | $124,902 | $30,821 | $94,081 |
| 2015 | $307 | $145,153 | $30,821 | $114,332 |
| 2014 | $1,813 | $127,481 | $28,062 | $99,419 |
Source: Public Records
Map
Nearby Homes
- 3462 W 2565 N
- 2741 N 3475 W
- 2255 N 3600 St W Unit 21
- 2233 N 3600 St W Unit 22
- Newport Plan at Diamond E
- 2727 N 3225 W Unit 201
- 2771 N 3225 W Unit 204
- 2761 N 3225 W Unit 203
- 2788 N 3225 W Unit 206
- 2768 N 3225 W Unit 208
- 3594 W 2200 N Unit 3
- 3622 W 2200 St N Unit 23
- 2443 W 2950 N Unit 99
- 2443 W 2950 N
- 2864 N 3475 W
- 3966 W 2200 N
- 3963 2800 North St
- 4212 W 1975 N
- 2495 N 2850 W
- 2307 N 2850 W