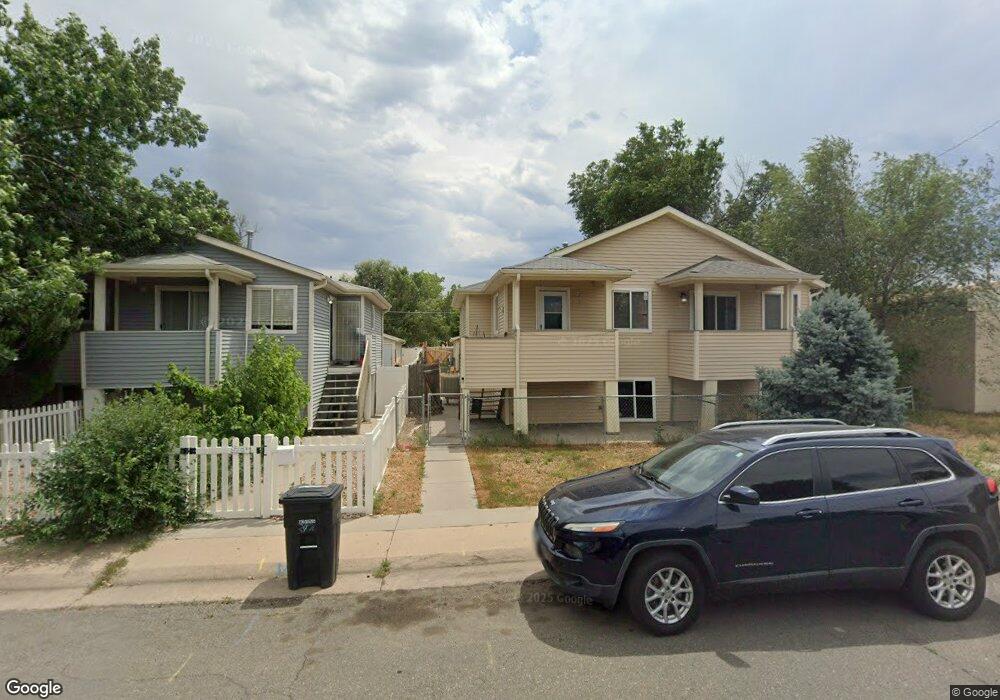
3478 W Walsh Place Denver, CO 80219
Westwood NeighborhoodEstimated Value: $343,000 - $436,000
3
Beds
2
Baths
1,434
Sq Ft
$265/Sq Ft
Est. Value
About This Home
This home is located at 3478 W Walsh Place, Denver, CO 80219 and is currently estimated at $379,963, approximately $264 per square foot. 3478 W Walsh Place is a home located in Denver County with nearby schools including Castro Elementary School, Kepner Beacon Middle School, and West High School.
Ownership History
Date
Name
Owned For
Owner Type
Purchase Details
Closed on
Mar 1, 2021
Sold by
Nguyen Ryan H
Bought by
Rh Nguyen Trust
Current Estimated Value
Purchase Details
Closed on
May 15, 2008
Sold by
Hsbc Bank Usa Na
Bought by
Nguyen Ryan H
Home Financials for this Owner
Home Financials are based on the most recent Mortgage that was taken out on this home.
Original Mortgage
$78,800
Interest Rate
6.07%
Mortgage Type
Purchase Money Mortgage
Purchase Details
Closed on
Apr 24, 2008
Sold by
Sanchez Estela
Bought by
Hsbc Bank Usa Na and The Certificateholders Nomura Home Equit
Home Financials for this Owner
Home Financials are based on the most recent Mortgage that was taken out on this home.
Original Mortgage
$78,800
Interest Rate
6.07%
Mortgage Type
Purchase Money Mortgage
Purchase Details
Closed on
Mar 25, 2005
Sold by
Obrien Donald L
Bought by
Sanchez Estela
Home Financials for this Owner
Home Financials are based on the most recent Mortgage that was taken out on this home.
Original Mortgage
$146,960
Interest Rate
5.71%
Mortgage Type
Purchase Money Mortgage
Create a Home Valuation Report for This Property
The Home Valuation Report is an in-depth analysis detailing your home's value as well as a comparison with similar homes in the area
Home Values in the Area
Average Home Value in this Area
Purchase History
| Date | Buyer | Sale Price | Title Company |
|---|---|---|---|
| Rh Nguyen Trust | -- | None Available | |
| Nguyen Ryan H | $98,500 | None Available | |
| Hsbc Bank Usa Na | -- | None Available | |
| Sanchez Estela | $183,700 | Utc |
Source: Public Records
Mortgage History
| Date | Status | Borrower | Loan Amount |
|---|---|---|---|
| Previous Owner | Nguyen Ryan H | $78,800 | |
| Previous Owner | Sanchez Estela | $146,960 |
Source: Public Records
Tax History Compared to Growth
Tax History
| Year | Tax Paid | Tax Assessment Tax Assessment Total Assessment is a certain percentage of the fair market value that is determined by local assessors to be the total taxable value of land and additions on the property. | Land | Improvement |
|---|---|---|---|---|
| 2024 | $1,754 | $22,140 | $380 | $21,760 |
| 2023 | $1,716 | $22,140 | $380 | $21,760 |
| 2022 | $1,583 | $19,900 | $3,900 | $16,000 |
| 2021 | $1,527 | $20,470 | $4,010 | $16,460 |
| 2020 | $1,624 | $21,890 | $3,040 | $18,850 |
| 2019 | $1,579 | $21,890 | $3,040 | $18,850 |
| 2018 | $1,177 | $15,210 | $2,180 | $13,030 |
| 2017 | $1,173 | $15,210 | $2,180 | $13,030 |
| 2016 | $945 | $11,590 | $2,054 | $9,536 |
| 2015 | $906 | $11,590 | $2,054 | $9,536 |
| 2014 | $667 | $8,030 | $1,290 | $6,740 |
Source: Public Records
Map
Nearby Homes
- 3470 W Walsh Place
- 3503 W Ada Place
- 855 S Knox Ct
- 3703 W Walsh Place
- 668 S Lowell Blvd
- 3520 W Center Ave
- 3245 W Walsh Place
- 3570 W Center Ave
- 3441 W Ford Place
- 3145 W Ada Place
- 3947 W Ohio Ave Unit 17
- 3174 W Center Ave
- 3918 W Kentucky Ave
- 538 S Osceola St
- 3228 W Virginia Ave
- 461 S Lowell Blvd
- 1065 S Irving St Unit west half of lot 24
- 655 S Perry St
- 3073 W Center Ave Unit A
- 3073 W Center Ave Unit C
- 3476 W Walsh Place
- 3476 W Walsh Place
- 3476 W Walsh Place
- 3480 W Walsh Place
- 3474 W Walsh Place
- 3472 W Walsh Place
- 3468 W Walsh Place
- 3468 W Walsh Place
- 3483 W Ohio Ave
- 3520 W Walsh Place
- 3481 W Walsh Place
- 3495 W Ohio Ave
- 3517 W Ohio Ave
- 3467 W Walsh Place
- 3475 W Ohio Ave
- 775 S Knox Ct
- 3465 W Walsh Place
- 3463 W Ohio Ave
- 3501 W Walsh Place
- 3457 W Walsh Place