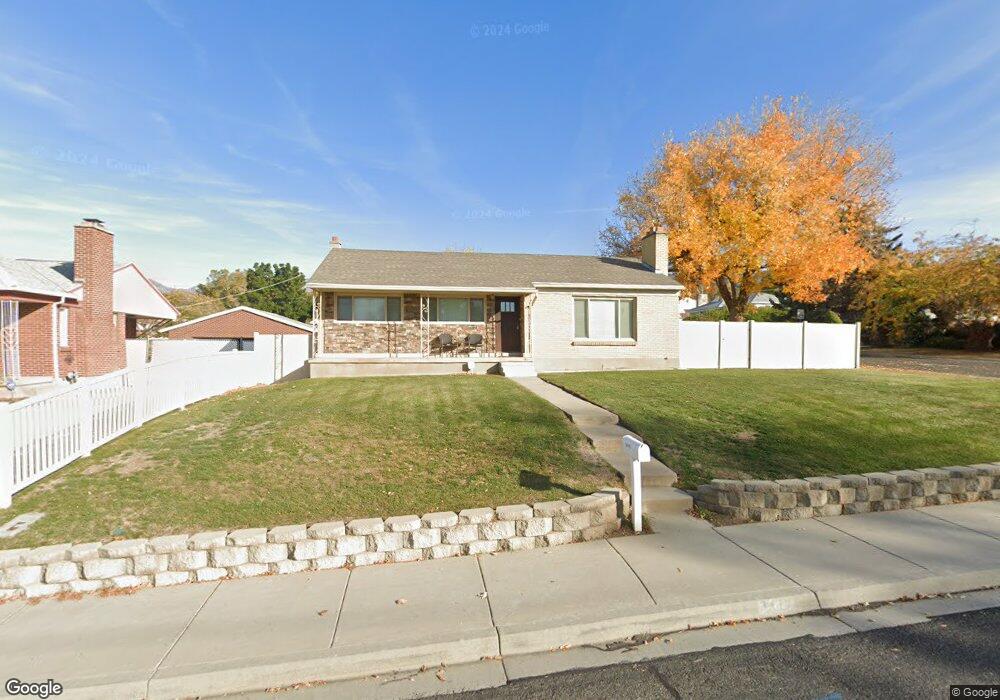
3479 S 800 W Bountiful, UT 84010
Estimated Value: $480,000 - $587,000
5
Beds
2
Baths
1,100
Sq Ft
$490/Sq Ft
Est. Value
About This Home
This home is located at 3479 S 800 W, Bountiful, UT 84010 and is currently estimated at $538,883, approximately $489 per square foot. 3479 S 800 W is a home located in Davis County with nearby schools including Adelaide School, South Davis Junior High School, and Woods Cross High School.
Ownership History
Date
Name
Owned For
Owner Type
Purchase Details
Closed on
Mar 26, 2021
Sold by
Thomas Kimberly B
Bought by
Thomas Kimberly B and Kimberly Thomas Living Trust
Current Estimated Value
Purchase Details
Closed on
Dec 23, 2010
Sold by
Thomas Kimberly B
Bought by
Thomas Kimberly B
Home Financials for this Owner
Home Financials are based on the most recent Mortgage that was taken out on this home.
Original Mortgage
$147,944
Interest Rate
3.71%
Mortgage Type
New Conventional
Purchase Details
Closed on
Sep 29, 2006
Sold by
Thomas Kimberly B
Bought by
Thomas Kimberly B
Home Financials for this Owner
Home Financials are based on the most recent Mortgage that was taken out on this home.
Original Mortgage
$150,727
Interest Rate
6.43%
Mortgage Type
FHA
Create a Home Valuation Report for This Property
The Home Valuation Report is an in-depth analysis detailing your home's value as well as a comparison with similar homes in the area
Purchase History
| Date | Buyer | Sale Price | Title Company |
|---|---|---|---|
| Thomas Kimberly B | -- | None Available | |
| Thomas Kimberly B | -- | First American Title | |
| Thomas Kimberly B | -- | Title One Inc |
Source: Public Records
Mortgage History
| Date | Status | Borrower | Loan Amount |
|---|---|---|---|
| Closed | Thomas Kimberly B | $147,944 | |
| Closed | Thomas Kimberly B | $150,727 |
Source: Public Records
Tax History
| Year | Tax Paid | Tax Assessment Tax Assessment Total Assessment is a certain percentage of the fair market value that is determined by local assessors to be the total taxable value of land and additions on the property. | Land | Improvement |
|---|---|---|---|---|
| 2025 | $2,913 | $263,450 | $134,366 | $129,084 |
| 2024 | $2,658 | $243,650 | $122,754 | $120,896 |
| 2023 | $2,568 | $424,000 | $223,348 | $200,652 |
| 2022 | $2,367 | $226,050 | $121,295 | $104,755 |
| 2021 | $2,212 | $321,000 | $158,848 | $162,152 |
| 2020 | $2,005 | $284,000 | $134,680 | $149,320 |
| 2019 | $2,000 | $278,000 | $135,539 | $142,461 |
| 2018 | $1,830 | $254,000 | $132,711 | $121,289 |
| 2016 | $1,436 | $113,960 | $44,920 | $69,040 |
| 2015 | $1,369 | $103,180 | $44,592 | $58,588 |
| 2014 | $1,366 | $105,103 | $44,592 | $60,511 |
| 2013 | -- | $103,859 | $39,292 | $64,567 |
Source: Public Records
Map
Nearby Homes
- 328 Pellinore St Unit 44
- 746 W 3200 S
- 683 Merlin St Unit 4630
- 652 W 3600 S
- 246 Guenevere St Unit 81
- 256 Excalibur St Unit 163
- 562 Lancelot Dr Unit 60
- 188 Excalibur St Unit 187
- 246 Galahad St
- 246 N Glenwood Way
- 621 Excalibur St Unit 143
- 366 N 175 E
- 785 Percival St
- 298 Percival St Unit 354
- 310 N 675 E
- 558 Eastpointe Cir
- 816 W 4100 S
- 587 Eastpointe Cir
- 189 E 210 N Unit 8
- 187 E 210 N Unit 7
Your Personal Tour Guide
Ask me questions while you tour the home.