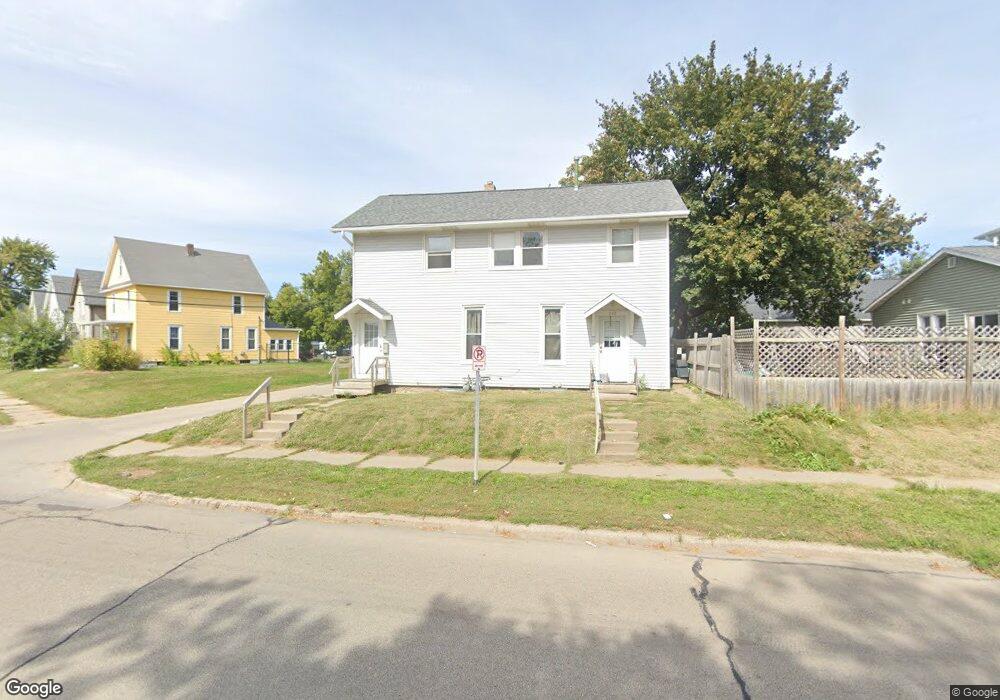
348 8th Ave SW Cedar Rapids, IA 52404
Taylor NeighborhoodEstimated Value: $129,000 - $195,913
4
Beds
2
Baths
1,656
Sq Ft
$94/Sq Ft
Est. Value
About This Home
This home is located at 348 8th Ave SW, Cedar Rapids, IA 52404 and is currently estimated at $156,304, approximately $94 per square foot. 348 8th Ave SW is a home located in Linn County with nearby schools including Cedar River Academy at Taylor Elementary School, Wilson Middle School, and Thomas Jefferson High School.
Ownership History
Date
Name
Owned For
Owner Type
Purchase Details
Closed on
Aug 17, 2017
Sold by
Carpender Randall R and Carpender Haley J
Bought by
Olen Vadim and Olen Krista J
Current Estimated Value
Home Financials for this Owner
Home Financials are based on the most recent Mortgage that was taken out on this home.
Original Mortgage
$63,200
Outstanding Balance
$49,166
Interest Rate
3.96%
Mortgage Type
Unknown
Estimated Equity
$107,138
Purchase Details
Closed on
May 10, 2016
Sold by
Huberty Christopher R
Bought by
Carpenter Randall R
Create a Home Valuation Report for This Property
The Home Valuation Report is an in-depth analysis detailing your home's value as well as a comparison with similar homes in the area
Home Values in the Area
Average Home Value in this Area
Purchase History
| Date | Buyer | Sale Price | Title Company |
|---|---|---|---|
| Olen Vadim | $126,100 | None Available | |
| Carpenter Randall R | -- | None Available |
Source: Public Records
Mortgage History
| Date | Status | Borrower | Loan Amount |
|---|---|---|---|
| Open | Olen Vadim | $63,200 |
Source: Public Records
Tax History
| Year | Tax Paid | Tax Assessment Tax Assessment Total Assessment is a certain percentage of the fair market value that is determined by local assessors to be the total taxable value of land and additions on the property. | Land | Improvement |
|---|---|---|---|---|
| 2025 | $1,906 | $143,700 | $24,400 | $119,300 |
| 2024 | $1,986 | $107,700 | $22,500 | $85,200 |
| 2023 | $1,986 | $107,700 | $22,500 | $85,200 |
| 2022 | $1,764 | $94,200 | $18,800 | $75,400 |
| 2021 | $1,716 | $85,200 | $18,800 | $66,400 |
| 2020 | $1,716 | $77,800 | $16,900 | $60,900 |
| 2019 | $1,630 | $75,600 | $16,900 | $58,700 |
| 2018 | $1,584 | $75,600 | $16,900 | $58,700 |
| 2017 | $1,778 | $81,600 | $16,900 | $64,700 |
| 2016 | $1,428 | $67,200 | $14,300 | $52,900 |
| 2015 | $1,428 | $69,949 | $14,344 | $55,605 |
| 2014 | $1,488 | $73,424 | $14,344 | $59,080 |
| 2013 | $1,528 | $73,424 | $14,344 | $59,080 |
Source: Public Records
Map
Nearby Homes
- 353 7th Ave SW
- 804 N St SW
- 702 L St SW
- 366 7th Ave SW
- 403 8th Ave SW
- 401 7th Ave SW
- 925 N St SW
- 524 4th St SW
- 452 8th Ave SW
- 460 9th Ave SW
- 116 6th Ave SW
- 715 9th Ave SW
- 1323 M St SW
- 1435 N St SW
- 3913 Bluebird Dr SW
- 531 9th St SW
- 818 10th Ave SW
- 828 8th Ave SW
- 200 3rd Ave SW Unit 400
- 359 15th Ave SW
Your Personal Tour Guide
Ask me questions while you tour the home.