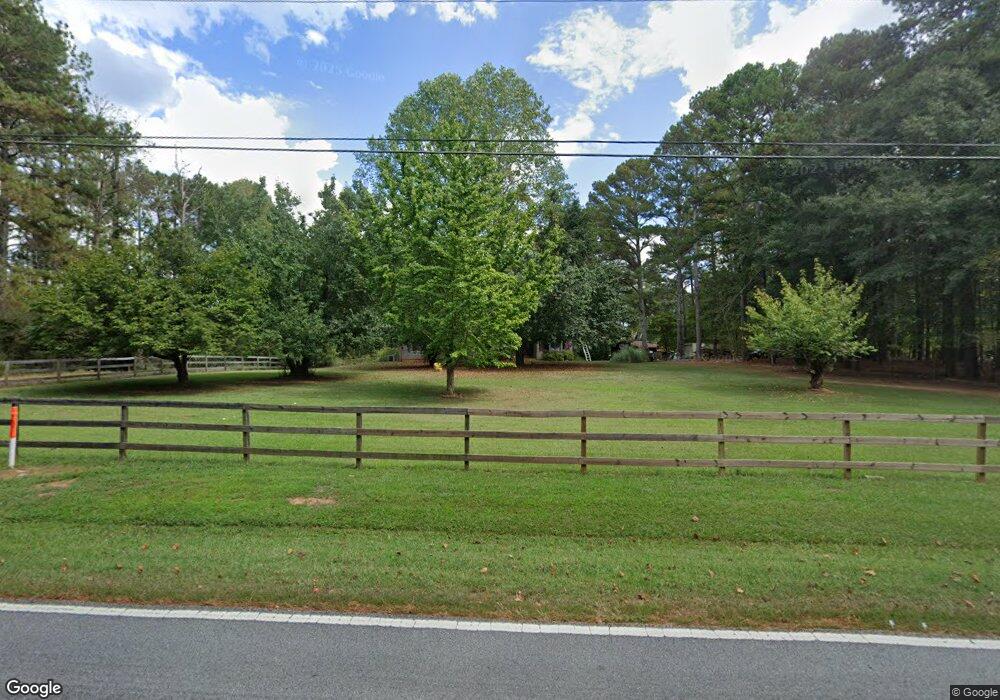
348 Brogdon Rd Fayetteville, GA 30214
Estimated Value: $372,000 - $406,000
--
Bed
2
Baths
1,768
Sq Ft
$222/Sq Ft
Est. Value
About This Home
This home is located at 348 Brogdon Rd, Fayetteville, GA 30214 and is currently estimated at $391,633, approximately $221 per square foot. 348 Brogdon Rd is a home located in Fayette County with nearby schools including North Fayette Elementary School, Bennett's Mill Middle School, and Fayette County High School.
Ownership History
Date
Name
Owned For
Owner Type
Purchase Details
Closed on
May 14, 2025
Sold by
Wells Joshua Aaron
Bought by
Wells William A and Wells Jared Aaron
Current Estimated Value
Purchase Details
Closed on
Mar 21, 2025
Sold by
Wells William A
Bought by
Wells Joshua Aaron
Purchase Details
Closed on
Dec 12, 2024
Sold by
Wells Joshua Breigh and Wells William A
Bought by
Wells William A
Purchase Details
Closed on
Apr 7, 2021
Sold by
Wells Loreta
Bought by
Wells Joshua Breigh and Wells William A
Purchase Details
Closed on
Aug 18, 2020
Sold by
Wells William A
Bought by
Wells Joshua Breigh
Purchase Details
Closed on
Apr 15, 1996
Sold by
Wells Paul Lois
Bought by
Wells William Loretta
Create a Home Valuation Report for This Property
The Home Valuation Report is an in-depth analysis detailing your home's value as well as a comparison with similar homes in the area
Home Values in the Area
Average Home Value in this Area
Purchase History
| Date | Buyer | Sale Price | Title Company |
|---|---|---|---|
| Wells William A | -- | None Listed On Document | |
| Wells William A | -- | None Listed On Document | |
| Wells Joshua Aaron | -- | None Listed On Document | |
| Wells Joshua Aaron | -- | None Listed On Document | |
| Wells William A | -- | None Listed On Document | |
| Wells Joshua Breigh | -- | Johnson Derrick | |
| Wells William A | -- | -- | |
| Wells Joshua Breigh | -- | -- | |
| Wells William Loretta | $126,900 | -- |
Source: Public Records
Mortgage History
| Date | Status | Borrower | Loan Amount |
|---|---|---|---|
| Closed | Wells William Loretta | $0 |
Source: Public Records
Tax History Compared to Growth
Tax History
| Year | Tax Paid | Tax Assessment Tax Assessment Total Assessment is a certain percentage of the fair market value that is determined by local assessors to be the total taxable value of land and additions on the property. | Land | Improvement |
|---|---|---|---|---|
| 2024 | $1,265 | $151,236 | $48,308 | $102,928 |
| 2023 | $1,265 | $139,576 | $41,256 | $98,320 |
| 2022 | $2,524 | $125,408 | $35,968 | $89,440 |
| 2021 | $2,318 | $102,760 | $32,440 | $70,320 |
| 2020 | $2,584 | $93,948 | $30,068 | $63,880 |
| 2019 | $2,514 | $90,508 | $30,068 | $60,440 |
| 2018 | $2,290 | $81,784 | $26,144 | $55,640 |
| 2017 | $2,038 | $72,792 | $24,512 | $48,280 |
| 2016 | $1,922 | $67,392 | $24,512 | $42,880 |
| 2015 | $1,855 | $63,992 | $24,512 | $39,480 |
| 2014 | $1,762 | $59,872 | $24,512 | $35,360 |
| 2013 | -- | $57,912 | $0 | $0 |
Source: Public Records
Map
Nearby Homes
- 0 Matteo Way Unit LOT 2
- 0 Matteo Way Unit LOT 32
- 0 Matteo Way Unit LOT 14
- 0 Matteo Way Unit LOT 15
- 0 Matteo Way Unit LOT 16
- 615 New Hope Rd
- 615 New Hope Rd Unit NO SUBDIVISION
- 220 Lang Dr
- 145 Walden Way Unit 2
- 190 Walden Way
- 210 New Oak Ridge Trail
- 100 Thornton Ct
- 100 Carlyle Ln
- 340 Magmar Ln
- 105 Brandon Mill Cir
- 150 Ashley Dr
- 0 Highway 92 N Unit 10594507
- 0 Highway 92 N Unit 7570733
- 145 Heritage Way
- 190 Rolison Way
- 350 Brogdon Rd
- 220 Edmondson Way
- 190 Edmondson Way
- 215 Edmondson Way
- 180 Edmondson Way
- 351 Brogdon Rd
- 205 Edmondson Way
- 170 Edmondson Way
- 0 Brodgon Rd Unit A 8208247
- 235 Byington Dr
- 225 Byington Dr
- 215 Byington Dr
- 205 Byington Dr
- 195 Edmondson Way
- 195 Byington Dr
- 315 Brogdon Rd
- 331 Brogdon Rd
- 160 Edmondson Way
- 367 Brogdon Rd
- 245 Byington Dr