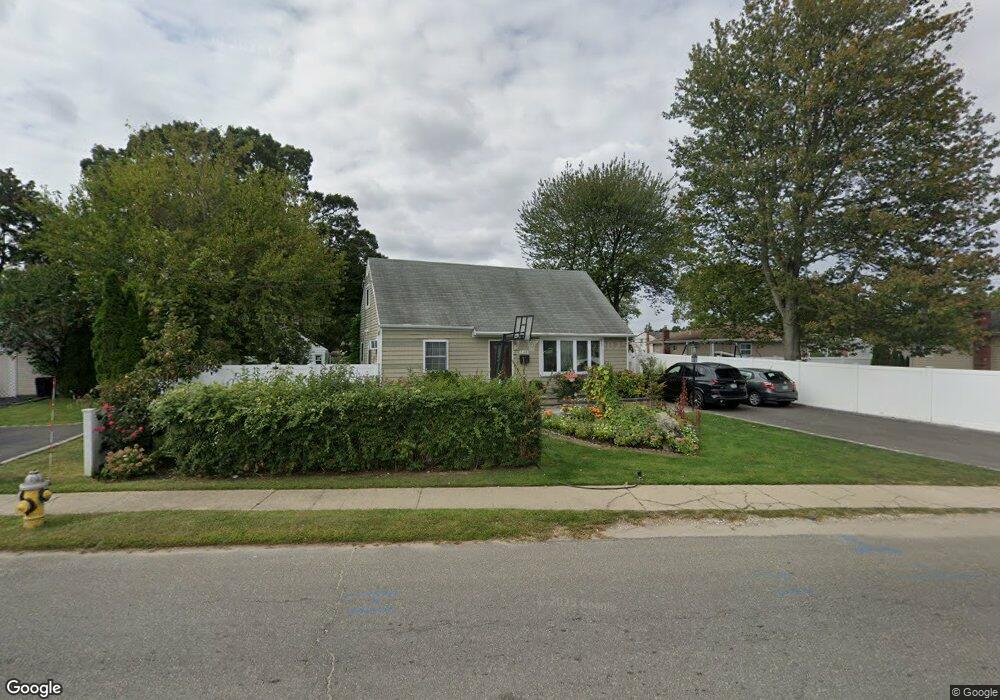
348 Carlls Path Deer Park, NY 11729
Estimated Value: $602,673 - $695,000
Studio
--
Bath
1,856
Sq Ft
$347/Sq Ft
Est. Value
About This Home
This home is located at 348 Carlls Path, Deer Park, NY 11729 and is currently estimated at $643,168, approximately $346 per square foot. 348 Carlls Path is a home located in Suffolk County with nearby schools including Robert Frost Middle School, Deer Park High School, and Upper Room Christian School.
Ownership History
Date
Name
Owned For
Owner Type
Purchase Details
Closed on
Sep 12, 2003
Sold by
Benitez Jose Nelson and Benitez Jose F
Bought by
Azam Mohammed G
Current Estimated Value
Home Financials for this Owner
Home Financials are based on the most recent Mortgage that was taken out on this home.
Original Mortgage
$285,000
Outstanding Balance
$126,321
Interest Rate
6.43%
Mortgage Type
Purchase Money Mortgage
Estimated Equity
$516,847
Purchase Details
Closed on
Mar 3, 2003
Sold by
Bergmann Richard T and Dinucci Michele
Bought by
Benitez Jose Nelson and Benitez Jose F
Home Financials for this Owner
Home Financials are based on the most recent Mortgage that was taken out on this home.
Original Mortgage
$260,600
Interest Rate
5.94%
Mortgage Type
FHA
Purchase Details
Closed on
Feb 29, 1996
Sold by
Bertucci Robert and Bertucci Maria
Bought by
Bergmann Richard T and Dinucci Michele
Create a Home Valuation Report for This Property
The Home Valuation Report is an in-depth analysis detailing your home's value as well as a comparison with similar homes in the area
Home Values in the Area
Average Home Value in this Area
Purchase History
We collect this data history from publicly available records. To have your information removed, we recommend requesting removal directly through your county’s website.
| Date | Buyer | Sale Price | Title Company |
|---|---|---|---|
| Azam Mohammed G | $300,000 | -- | |
| Benitez Jose Nelson | $264,700 | -- | |
| Bergmann Richard T | $120,000 | First American Title Ins Co |
Source: Public Records
Mortgage History
We collect this data history from publicly available records. To have your information removed, we recommend requesting removal directly through your county’s website.
| Date | Status | Borrower | Loan Amount |
|---|---|---|---|
| Open | Azam Mohammed G | $285,000 | |
| Previous Owner | Benitez Jose Nelson | $260,600 |
Source: Public Records
Tax History
| Year | Tax Paid | Tax Assessment Tax Assessment Total Assessment is a certain percentage of the fair market value that is determined by local assessors to be the total taxable value of land and additions on the property. | Land | Improvement |
|---|---|---|---|---|
| 2024 | $11,626 | $3,560 | $380 | $3,180 |
| 2023 | $11,626 | $3,560 | $380 | $3,180 |
| 2022 | $9,501 | $3,560 | $380 | $3,180 |
| 2021 | $9,501 | $3,560 | $380 | $3,180 |
| 2020 | $10,317 | $3,560 | $380 | $3,180 |
| 2019 | $10,317 | $0 | $0 | $0 |
| 2018 | $9,666 | $3,560 | $380 | $3,180 |
| 2017 | $9,666 | $3,560 | $380 | $3,180 |
| 2016 | $9,609 | $3,560 | $380 | $3,180 |
| 2015 | -- | $3,560 | $380 | $3,180 |
| 2014 | -- | $3,560 | $380 | $3,180 |
Source: Public Records
Map
Nearby Homes
Your Personal Tour Guide
Ask me questions while you tour the home.