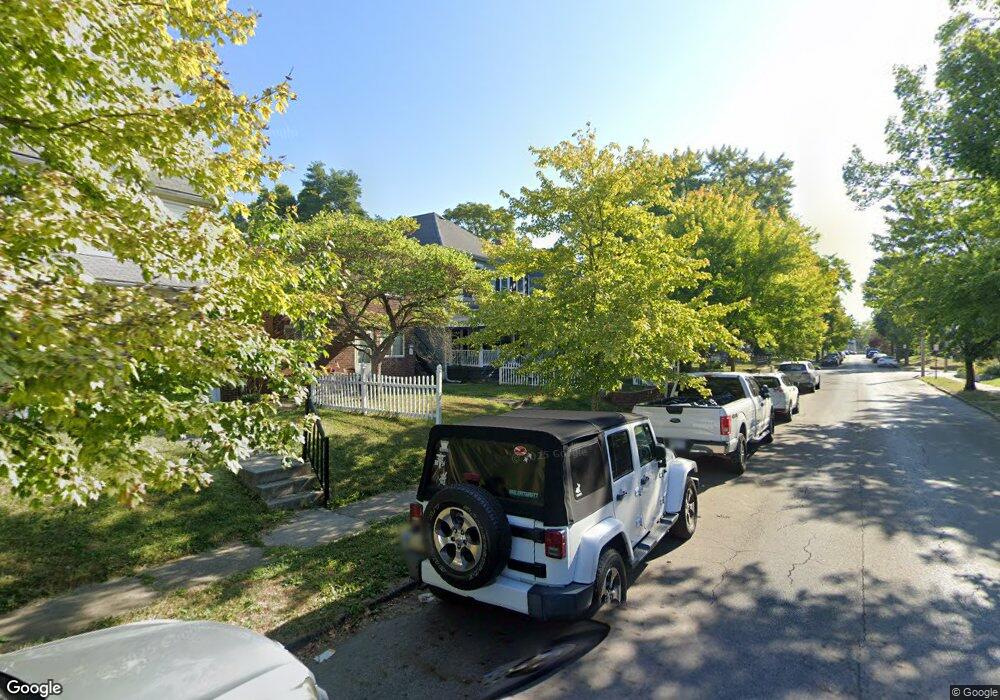
348 E Morrill Ave Columbus, OH 43207
Merion Village NeighborhoodEstimated Value: $341,000 - $381,764
3
Beds
2
Baths
1,984
Sq Ft
$186/Sq Ft
Est. Value
About This Home
This home is located at 348 E Morrill Ave, Columbus, OH 43207 and is currently estimated at $368,691, approximately $185 per square foot. 348 E Morrill Ave is a home located in Franklin County with nearby schools including Southwood Elementary School, South High School, and South Columbus Preparatory Academy.
Ownership History
Date
Name
Owned For
Owner Type
Purchase Details
Closed on
Aug 28, 2007
Sold by
Jordan Teresa M and Jordan Max
Bought by
Jaynes Kevin A
Current Estimated Value
Home Financials for this Owner
Home Financials are based on the most recent Mortgage that was taken out on this home.
Original Mortgage
$111,000
Outstanding Balance
$69,485
Interest Rate
6.71%
Mortgage Type
Purchase Money Mortgage
Estimated Equity
$299,206
Purchase Details
Closed on
Nov 29, 2006
Sold by
Jordan Teresa M
Bought by
Jordan Max and Jordan Teresa M
Home Financials for this Owner
Home Financials are based on the most recent Mortgage that was taken out on this home.
Original Mortgage
$114,750
Interest Rate
9.45%
Mortgage Type
New Conventional
Purchase Details
Closed on
Apr 19, 2006
Sold by
Rush James J and Estate Of Dorothy L Mumford
Bought by
Jordan Teresa M
Home Financials for this Owner
Home Financials are based on the most recent Mortgage that was taken out on this home.
Original Mortgage
$106,304
Interest Rate
6.48%
Mortgage Type
Purchase Money Mortgage
Purchase Details
Closed on
Mar 27, 1970
Bought by
Mumford Dorothy L
Create a Home Valuation Report for This Property
The Home Valuation Report is an in-depth analysis detailing your home's value as well as a comparison with similar homes in the area
Home Values in the Area
Average Home Value in this Area
Purchase History
| Date | Buyer | Sale Price | Title Company |
|---|---|---|---|
| Jaynes Kevin A | $111,000 | Amerititle | |
| Jordan Max | -- | Vta | |
| Jordan Teresa M | $52,000 | Apex Title | |
| Mumford Dorothy L | -- | -- |
Source: Public Records
Mortgage History
| Date | Status | Borrower | Loan Amount |
|---|---|---|---|
| Open | Jaynes Kevin A | $111,000 | |
| Previous Owner | Jordan Max | $114,750 | |
| Previous Owner | Jordan Teresa M | $106,304 |
Source: Public Records
Tax History
| Year | Tax Paid | Tax Assessment Tax Assessment Total Assessment is a certain percentage of the fair market value that is determined by local assessors to be the total taxable value of land and additions on the property. | Land | Improvement |
|---|---|---|---|---|
| 2025 | $6,341 | $141,300 | $49,070 | $92,230 |
| 2024 | $6,341 | $141,300 | $49,070 | $92,230 |
| 2023 | $6,260 | $141,295 | $49,070 | $92,225 |
| 2022 | $3,424 | $66,010 | $11,900 | $54,110 |
| 2021 | $3,430 | $66,010 | $11,900 | $54,110 |
| 2020 | $3,434 | $66,010 | $11,900 | $54,110 |
| 2019 | $2,764 | $45,570 | $8,820 | $36,750 |
| 2018 | $2,392 | $45,570 | $8,820 | $36,750 |
| 2017 | $2,497 | $45,570 | $8,820 | $36,750 |
| 2016 | $2,230 | $33,670 | $6,020 | $27,650 |
| 2015 | $2,025 | $33,670 | $6,020 | $27,650 |
| 2014 | $2,030 | $33,670 | $6,020 | $27,650 |
| 2013 | $1,113 | $37,415 | $6,685 | $30,730 |
Source: Public Records
Map
Nearby Homes
- 379 E Morrill Ave
- 332 E Hinman Ave
- 1624 S 8th St
- 1692 Parsons Ave
- 1696 Parsons Ave
- 284-286 E Markison Ave
- 464 E Hinman Ave
- 236 E Welch Ave
- 301 Southwood Ave
- 472 E Hinman Ave
- 220 E Welch Ave
- 495 E Welch Ave
- 457 E Woodrow Ave Unit 459
- 218 E Markison Ave
- 1756 Bruck St
- 1563 S 6th St
- 1657 Ann St
- 177 E Hinman Ave
- 172 E Woodrow Ave
- 149 E Hinman Ave
- 350 E Morrill Ave
- 342 E Morrill Ave Unit 344
- 356 E Morrill Ave
- 336 E Morrill Ave Unit 338
- 334 E Morrill Ave
- 330 E Morrill Ave
- 366 Morrill Ave
- 366 -368 E Morrill Ave Unit 368
- 366 -368 E Morrill Ave Unit 366 E Morrill Av
- 366 E Morrill Ave Unit 368
- 368 E Morrill Ave
- 366 E Morrill Ave Unit 8
- 0 E Morrill Ave Unit 221045808
- 0 E Morrill Ave
- 347 E Welch Ave
- 353 E Welch Ave
- 357-359 E Welch Ave
- 343 E Welch Ave
- 370 E Morrill Ave Unit 372
- 337 E Welch Ave
Your Personal Tour Guide
Ask me questions while you tour the home.