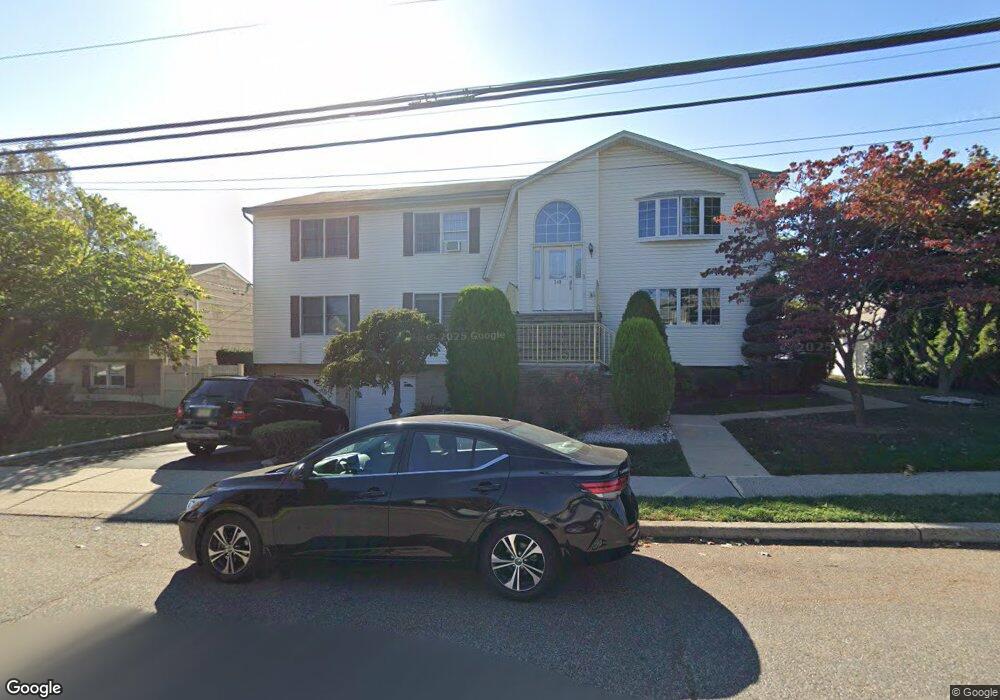
348 Floral Ln Saddle Brook, NJ 07663
Estimated Value: $873,431 - $1,066,000
--
Bed
--
Bath
3,250
Sq Ft
$310/Sq Ft
Est. Value
About This Home
This home is located at 348 Floral Ln, Saddle Brook, NJ 07663 and is currently estimated at $1,007,608, approximately $310 per square foot. 348 Floral Ln is a home located in Bergen County with nearby schools including Saddle Brook Mid High School and Noble Leadership Academy.
Ownership History
Date
Name
Owned For
Owner Type
Purchase Details
Closed on
Aug 17, 2005
Sold by
Scheffler Martin
Bought by
Teran Alvaro and Teran Rosa
Current Estimated Value
Home Financials for this Owner
Home Financials are based on the most recent Mortgage that was taken out on this home.
Original Mortgage
$640,000
Outstanding Balance
$336,200
Interest Rate
5.66%
Estimated Equity
$671,408
Purchase Details
Closed on
Jan 19, 1996
Sold by
Floral Lane Assoc
Bought by
Scheffler Martin and Unger Kathryn
Home Financials for this Owner
Home Financials are based on the most recent Mortgage that was taken out on this home.
Original Mortgage
$233,000
Interest Rate
7.16%
Create a Home Valuation Report for This Property
The Home Valuation Report is an in-depth analysis detailing your home's value as well as a comparison with similar homes in the area
Home Values in the Area
Average Home Value in this Area
Purchase History
| Date | Buyer | Sale Price | Title Company |
|---|---|---|---|
| Teran Alvaro | $800,000 | -- | |
| Scheffler Martin | $355,000 | -- |
Source: Public Records
Mortgage History
| Date | Status | Borrower | Loan Amount |
|---|---|---|---|
| Open | Teran Alvaro | $640,000 | |
| Previous Owner | Scheffler Martin | $233,000 |
Source: Public Records
Tax History Compared to Growth
Tax History
| Year | Tax Paid | Tax Assessment Tax Assessment Total Assessment is a certain percentage of the fair market value that is determined by local assessors to be the total taxable value of land and additions on the property. | Land | Improvement |
|---|---|---|---|---|
| 2025 | $15,114 | $668,700 | $250,000 | $418,700 |
| 2024 | $13,841 | $655,400 | $245,000 | $410,400 |
| 2023 | $13,627 | $592,500 | $237,500 | $355,000 |
| 2022 | $13,627 | $567,300 | $224,400 | $342,900 |
| 2021 | $13,319 | $511,500 | $192,900 | $318,600 |
| 2020 | $12,898 | $500,900 | $188,900 | $312,000 |
| 2019 | $12,763 | $492,200 | $186,400 | $305,800 |
| 2018 | $12,408 | $489,100 | $181,900 | $307,200 |
| 2017 | $12,385 | $480,400 | $179,400 | $301,000 |
| 2016 | $13,067 | $456,100 | $171,000 | $285,100 |
| 2015 | $12,383 | $456,100 | $171,000 | $285,100 |
| 2014 | $11,950 | $456,100 | $171,000 | $285,100 |
Source: Public Records
Map
Nearby Homes