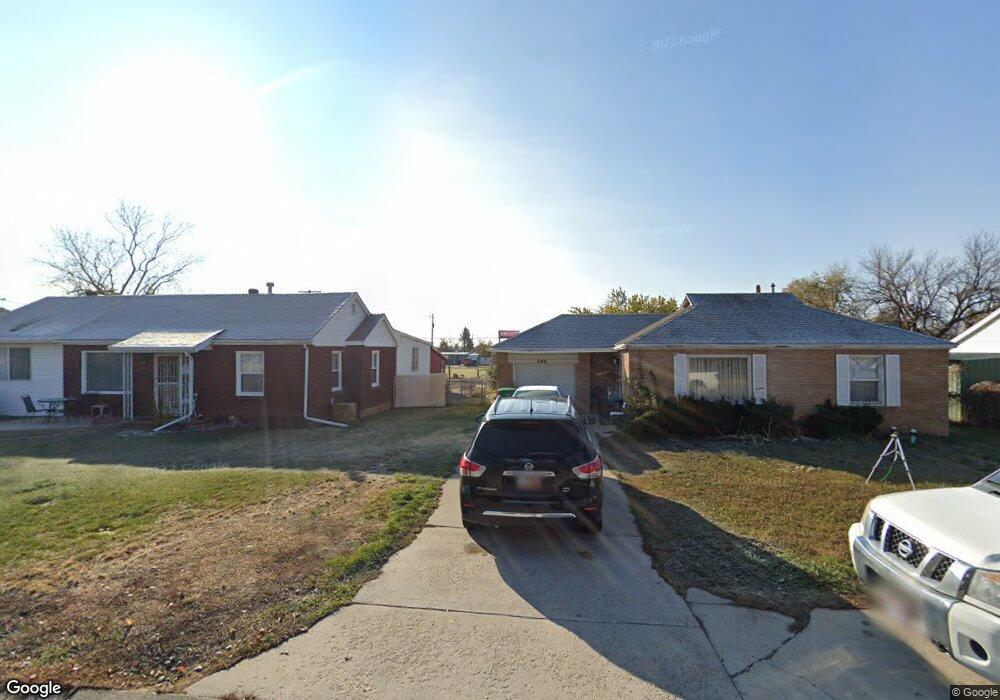
348 Francis Ave Layton, UT 84041
Estimated Value: $317,000 - $382,000
2
Beds
1
Bath
772
Sq Ft
$446/Sq Ft
Est. Value
About This Home
This home is located at 348 Francis Ave, Layton, UT 84041 and is currently estimated at $344,458, approximately $446 per square foot. 348 Francis Ave is a home located in Davis County with nearby schools including Crestview Elementary School, Central Davis Junior High School, and Layton High School.
Ownership History
Date
Name
Owned For
Owner Type
Purchase Details
Closed on
Dec 19, 2002
Sold by
Vanorden Maurice
Bought by
Vanorden Maurice and Vanorden Carol
Current Estimated Value
Purchase Details
Closed on
Aug 1, 2002
Sold by
Plumley Gloria I and Plumley Thomas L
Bought by
Vanorden Maurice
Purchase Details
Closed on
Mar 10, 2000
Sold by
Cooper Don G
Bought by
Plumley Ii Thomas L and Plumley Gloria I
Purchase Details
Closed on
Feb 5, 1998
Sold by
Swartz Michael V and Swartz Shalie M
Bought by
Cooper Don G
Home Financials for this Owner
Home Financials are based on the most recent Mortgage that was taken out on this home.
Original Mortgage
$77,900
Interest Rate
6.95%
Purchase Details
Closed on
Apr 19, 1996
Sold by
Steed Jared and Steed Cristina
Bought by
Swartz Michael and Swartz Shalie M
Home Financials for this Owner
Home Financials are based on the most recent Mortgage that was taken out on this home.
Original Mortgage
$66,400
Interest Rate
7.41%
Create a Home Valuation Report for This Property
The Home Valuation Report is an in-depth analysis detailing your home's value as well as a comparison with similar homes in the area
Home Values in the Area
Average Home Value in this Area
Purchase History
| Date | Buyer | Sale Price | Title Company |
|---|---|---|---|
| Vanorden Maurice | -- | -- | |
| Vanorden Maurice | -- | Superior Title Company Inc | |
| Plumley Ii Thomas L | -- | First American Title Co | |
| Cooper Don G | -- | Backman Stewart Title Servic | |
| Swartz Michael | -- | Stewart Title |
Source: Public Records
Mortgage History
| Date | Status | Borrower | Loan Amount |
|---|---|---|---|
| Previous Owner | Cooper Don G | $77,900 | |
| Previous Owner | Swartz Michael | $66,400 |
Source: Public Records
Tax History
| Year | Tax Paid | Tax Assessment Tax Assessment Total Assessment is a certain percentage of the fair market value that is determined by local assessors to be the total taxable value of land and additions on the property. | Land | Improvement |
|---|---|---|---|---|
| 2025 | $1,514 | $158,950 | $107,896 | $51,054 |
| 2024 | $1,456 | $153,999 | $125,357 | $28,642 |
| 2023 | $1,384 | $141,900 | $80,141 | $61,758 |
| 2022 | $1,397 | $257,000 | $141,865 | $115,135 |
| 2021 | $1,345 | $203,000 | $112,105 | $90,895 |
| 2020 | $1,208 | $175,000 | $93,204 | $81,796 |
| 2019 | $1,184 | $168,000 | $87,510 | $80,490 |
| 2018 | $1,046 | $149,000 | $87,510 | $61,490 |
| 2016 | $905 | $66,441 | $28,683 | $37,758 |
| 2015 | $862 | $60,116 | $28,683 | $31,433 |
| 2014 | $783 | $55,799 | $28,683 | $27,116 |
| 2013 | -- | $58,094 | $16,544 | $41,550 |
Source: Public Records
Map
Nearby Homes
- 1096 N 300 W
- 526 King St Unit 2
- 1148 N 350 W
- 34 E 525 N
- 975 N Garnet St
- 126 E 1150 N
- 1085 N 125 E
- 270 N 630 W
- 965 Amethyst St
- 103 E 1250 N
- 24 Grover St
- 1676 N Main St
- 1366 N Main St Unit 5
- 1113 W Angel Hill Ct
- 630 W 100 N
- 361 W 50 N
- 418 W Gentile St
- 339 W 25 N Unit 6
- 355 W Gentile St
- 1171 W Gordon Ave
- 348 Francis Ave
- 360 Francis Ave
- 338 Francis Ave
- 318 Francis Ave
- 351 Francis Ave
- 304 Francis Ave
- 337 Francis Ave
- 361 Francis Ave
- 329 Francis Ave
- 321 Francis Ave
- 296 Francis Ave
- 295 Francis Ave
- 296 Glen Ave
- 341 W Golden Ave
- 278 Francis Ave
- 348 Glen Ave
- 284 Glen Ave
- 336 Glen Ave
- 310 Glen Ave
- 284 Glen Ave N
Your Personal Tour Guide
Ask me questions while you tour the home.