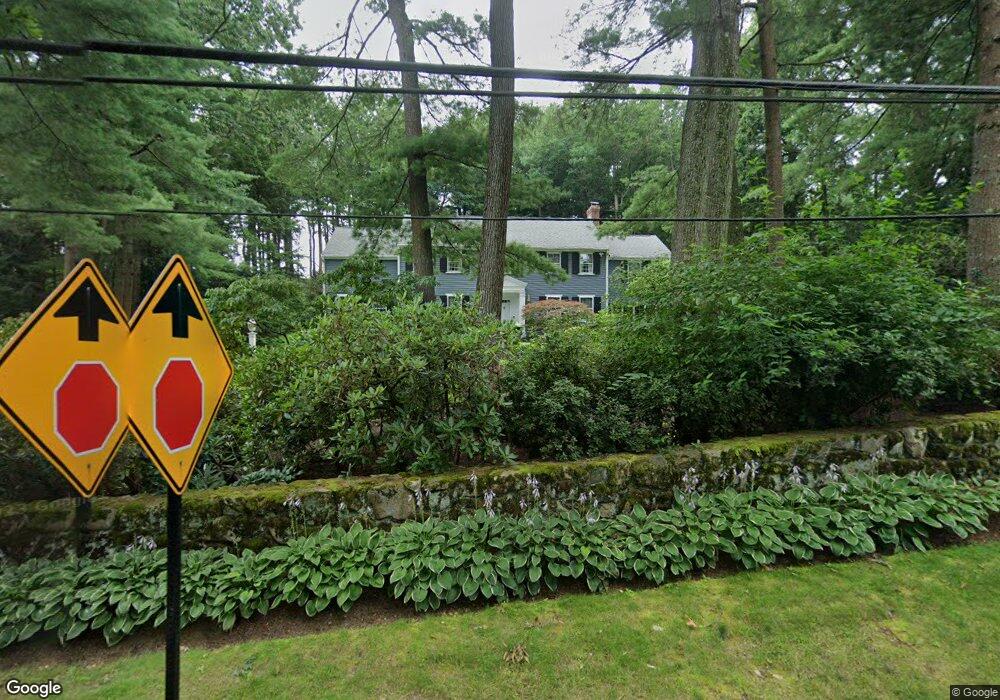
348 Glen Rd Weston, MA 02493
Estimated Value: $2,387,000 - $3,423,000
4
Beds
3
Baths
3,728
Sq Ft
$726/Sq Ft
Est. Value
About This Home
This home is located at 348 Glen Rd, Weston, MA 02493 and is currently estimated at $2,707,874, approximately $726 per square foot. 348 Glen Rd is a home located in Middlesex County with nearby schools including Country Elementary School, Woodland Elementary School, and Field Elementary School.
Ownership History
Date
Name
Owned For
Owner Type
Purchase Details
Closed on
Mar 5, 2009
Sold by
Foster C Stephen and Foster Frances B
Bought by
348 Glen Road Rt and Foster C Stephen
Current Estimated Value
Create a Home Valuation Report for This Property
The Home Valuation Report is an in-depth analysis detailing your home's value as well as a comparison with similar homes in the area
Home Values in the Area
Average Home Value in this Area
Purchase History
| Date | Buyer | Sale Price | Title Company |
|---|---|---|---|
| 348 Glen Road Rt | -- | -- |
Source: Public Records
Tax History
| Year | Tax Paid | Tax Assessment Tax Assessment Total Assessment is a certain percentage of the fair market value that is determined by local assessors to be the total taxable value of land and additions on the property. | Land | Improvement |
|---|---|---|---|---|
| 2025 | $23,659 | $2,131,400 | $1,170,800 | $960,600 |
| 2024 | $23,217 | $2,087,900 | $1,170,800 | $917,100 |
| 2023 | $23,416 | $1,977,700 | $1,170,800 | $806,900 |
| 2022 | $23,245 | $1,814,600 | $1,118,600 | $696,000 |
| 2021 | $4,525 | $1,725,500 | $1,063,400 | $662,100 |
| 2020 | $4,367 | $1,686,600 | $1,063,400 | $623,200 |
| 2019 | $4,579 | $1,680,300 | $1,063,400 | $616,900 |
| 2018 | $4,343 | $1,680,300 | $1,063,400 | $616,900 |
| 2017 | $20,836 | $1,680,300 | $1,063,400 | $616,900 |
| 2016 | $20,432 | $1,680,300 | $1,063,400 | $616,900 |
| 2015 | $19,805 | $1,612,800 | $1,013,600 | $599,200 |
Source: Public Records
Map
Nearby Homes
- 300 Glen Rd
- 100 Westcliff Rd
- 200 Cliff Rd
- 45 White Oak Rd
- 14 Greylock Rd
- 3 Ravine Rd
- 65 Woodcliff Rd
- 84 Royalston Rd
- 556 Wellesley St
- 568 Wellesley St
- 169 Hickory Rd
- 22 Cranmore Rd
- 120 Rockport Rd
- 52 Valley Rd
- 141 Hampshire Rd
- 2 Candleberry Ln
- 99 Old Colony Rd
- 135 Orchard Ave
- 162 Hampshire Rd
- 22 Valley Rd
Your Personal Tour Guide
Ask me questions while you tour the home.