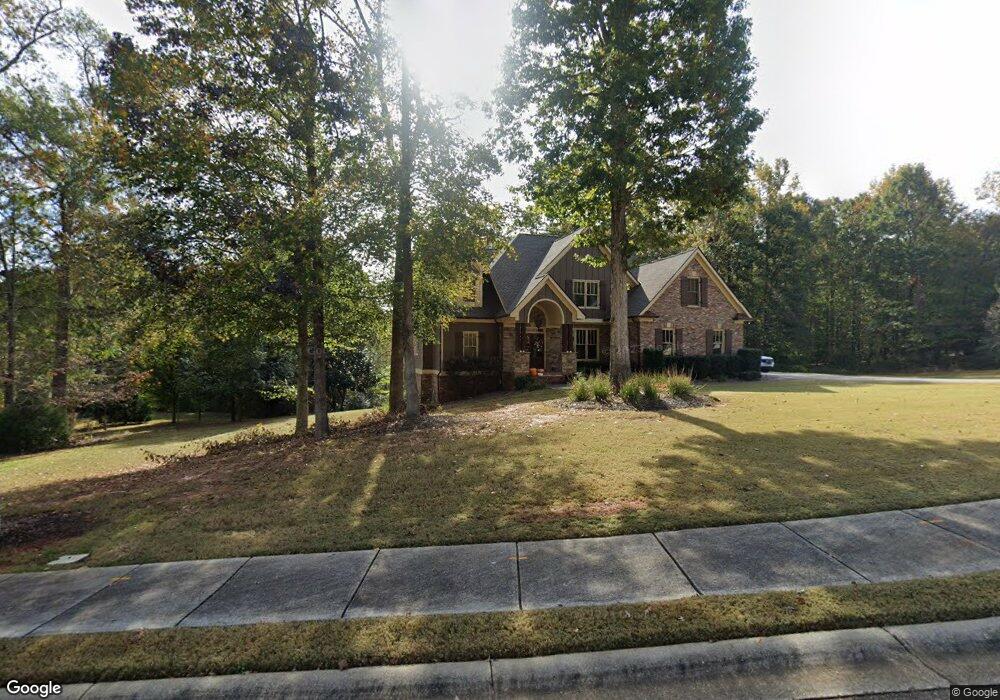
348 Hidden Trail Pendergrass, GA 30567
Estimated Value: $481,532 - $604,000
5
Beds
4
Baths
2,701
Sq Ft
$199/Sq Ft
Est. Value
About This Home
This home is located at 348 Hidden Trail, Pendergrass, GA 30567 and is currently estimated at $537,633, approximately $199 per square foot. 348 Hidden Trail is a home located in Jackson County with nearby schools including West Jackson Elementary School, West Jackson Middle School, and Jackson County High School.
Ownership History
Date
Name
Owned For
Owner Type
Purchase Details
Closed on
Feb 26, 2009
Sold by
Federal National Mortgage Association
Bought by
Cimarossa Darren W
Current Estimated Value
Home Financials for this Owner
Home Financials are based on the most recent Mortgage that was taken out on this home.
Original Mortgage
$201,248
Outstanding Balance
$125,128
Interest Rate
5.12%
Mortgage Type
New Conventional
Estimated Equity
$412,505
Purchase Details
Closed on
Jul 1, 2008
Sold by
Suntrust Mtg Inc
Bought by
Federal National Mtg Associati
Purchase Details
Closed on
Jun 29, 2007
Sold by
Not Provided
Bought by
Cimarossa Darren W and Cimarossa Emily K
Home Financials for this Owner
Home Financials are based on the most recent Mortgage that was taken out on this home.
Original Mortgage
$365,485
Interest Rate
6.37%
Mortgage Type
New Conventional
Purchase Details
Closed on
Mar 20, 2006
Sold by
Not Provided
Bought by
Cimarossa Darren W and Cimarossa Emily K
Create a Home Valuation Report for This Property
The Home Valuation Report is an in-depth analysis detailing your home's value as well as a comparison with similar homes in the area
Home Values in the Area
Average Home Value in this Area
Purchase History
| Date | Buyer | Sale Price | Title Company |
|---|---|---|---|
| Cimarossa Darren W | $236,763 | -- | |
| Federal National Mtg Associati | $311,805 | -- | |
| Suntrust Mtg Inc | $311,805 | -- | |
| Cimarossa Darren W | $384,700 | -- | |
| Cimarossa Darren W | $55,158 | -- |
Source: Public Records
Mortgage History
| Date | Status | Borrower | Loan Amount |
|---|---|---|---|
| Open | Cimarossa Darren W | $201,248 | |
| Previous Owner | Cimarossa Darren W | $365,485 |
Source: Public Records
Tax History
| Year | Tax Paid | Tax Assessment Tax Assessment Total Assessment is a certain percentage of the fair market value that is determined by local assessors to be the total taxable value of land and additions on the property. | Land | Improvement |
|---|---|---|---|---|
| 2025 | $4,806 | $209,480 | $50,000 | $159,480 |
| 2024 | $4,806 | $180,280 | $20,800 | $159,480 |
| 2023 | $4,331 | $162,920 | $20,800 | $142,120 |
| 2022 | $3,793 | $135,480 | $20,800 | $114,680 |
| 2021 | $3,551 | $125,880 | $11,200 | $114,680 |
| 2020 | $3,136 | $101,240 | $11,200 | $90,040 |
| 2019 | $3,251 | $103,400 | $11,200 | $92,200 |
| 2018 | $3,151 | $98,800 | $11,200 | $87,600 |
| 2017 | $2,984 | $92,631 | $11,200 | $81,431 |
| 2016 | $3,000 | $92,631 | $11,200 | $81,431 |
| 2015 | $3,014 | $92,631 | $11,200 | $81,431 |
| 2014 | $3,026 | $92,296 | $11,200 | $81,096 |
| 2013 | -- | $83,926 | $11,200 | $72,726 |
Source: Public Records
Map
Nearby Homes
- 121 Hewett Rd
- 37 Sealy Place
- 749 Hubert Pittman Tract 3 Rd
- 749 Hubert Pittman Rd Unit TRACT 2
- 749 Hubert Pittman Rd Unit TRACT 2 AND 3
- 749 Hubert Pittman Rd
- 749 Hubert Pittman Rd Unit TRACT 3
- 749 Hubert Pittman Tract 2 Rd
- 00 Route 60
- 647 Fairview Rd
- 45 River Chase
- 114 River Bluff
- 154 River Branch Way
- 411 Meadow Lake Terrace
- 1273 Highway 60
- 787 Reece Dr
- 0 Guy Cooper Rd Unit 10545221
- 4515 Highway 60
- 693 Reece Dr
- 1178 Pinnacle Dr
- 377 Hidden Trail
- 357 Hidden Trail
- 333 Hidden Trail
- 298 Hidden Trail
- 388 Hidden Trail
- 315 Hidden Trail
- 398 Hidden Trail
- 289 Hidden Trail
- 289 Hidden Trail Unit 11
- 278 Hidden Trail
- 397 Hidden Trail
- 254 Hidden Trail
- 267 Hidden Trail
- 267 Hidden Trail Unit 10
- 235 Hidden Trail
- 232 Hidden Trail
- 72 Murphy Rd
- 214 Hidden Trail
- 170 Hewett Rd
- 187 Hidden Trail
Your Personal Tour Guide
Ask me questions while you tour the home.