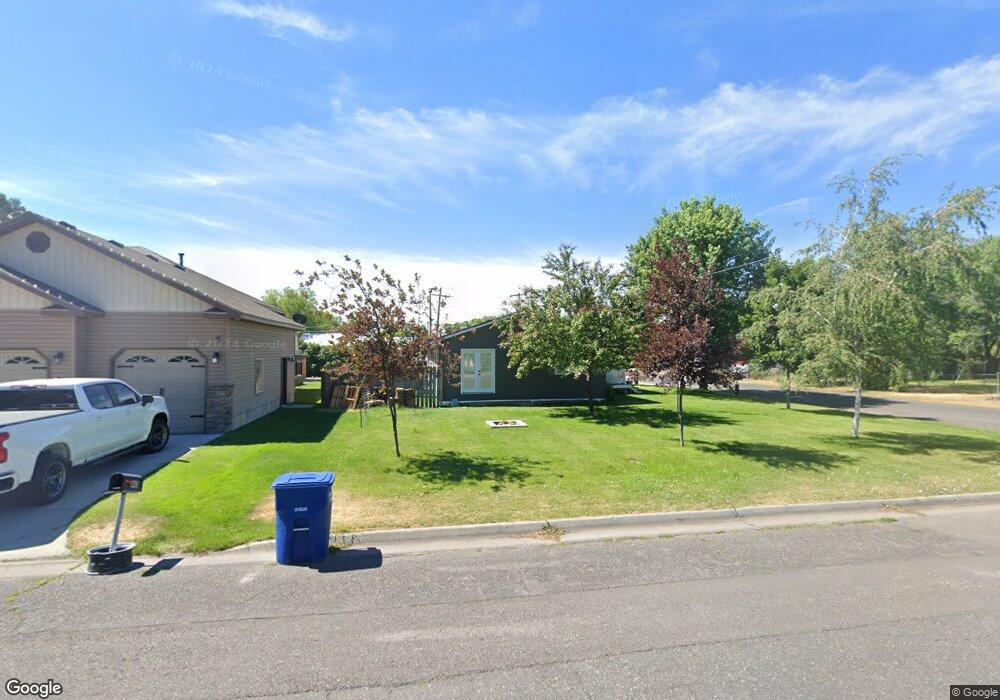
348 N 4th E Saint Anthony, ID 83445
Estimated Value: $265,000 - $301,000
3
Beds
1
Bath
1,092
Sq Ft
$260/Sq Ft
Est. Value
About This Home
This home is located at 348 N 4th E, Saint Anthony, ID 83445 and is currently estimated at $283,561, approximately $259 per square foot. 348 N 4th E is a home located in Fremont County with nearby schools including Henrys Fork Elementary School, South Fremont Junior High School, and South Fremont High School.
Ownership History
Date
Name
Owned For
Owner Type
Purchase Details
Closed on
Jun 2, 2008
Sold by
Goodnough Gary and Goodnough Dawn
Bought by
Lehmkuhl Joshua Joe and Lehmkuhl Erika
Current Estimated Value
Home Financials for this Owner
Home Financials are based on the most recent Mortgage that was taken out on this home.
Original Mortgage
$120,026
Outstanding Balance
$76,308
Interest Rate
5.87%
Mortgage Type
VA
Estimated Equity
$207,253
Create a Home Valuation Report for This Property
The Home Valuation Report is an in-depth analysis detailing your home's value as well as a comparison with similar homes in the area
Home Values in the Area
Average Home Value in this Area
Purchase History
| Date | Buyer | Sale Price | Title Company |
|---|---|---|---|
| Lehmkuhl Joshua Joe | -- | -- |
Source: Public Records
Mortgage History
| Date | Status | Borrower | Loan Amount |
|---|---|---|---|
| Open | Lehmkuhl Joshua Joe | $120,026 |
Source: Public Records
Tax History
| Year | Tax Paid | Tax Assessment Tax Assessment Total Assessment is a certain percentage of the fair market value that is determined by local assessors to be the total taxable value of land and additions on the property. | Land | Improvement |
|---|---|---|---|---|
| 2025 | $902 | $101,840 | $20,625 | $81,215 |
| 2024 | $869 | $95,303 | $20,625 | $74,678 |
| 2023 | $828 | $95,303 | $20,625 | $74,678 |
| 2022 | $1,082 | $79,490 | $20,625 | $58,865 |
| 2021 | $1,102 | $64,176 | $16,875 | $47,301 |
| 2020 | $1,108 | $60,223 | $16,875 | $43,348 |
| 2019 | $1,083 | $58,895 | $16,875 | $42,020 |
| 2018 | $1,021 | $51,577 | $16,875 | $34,702 |
| 2017 | $10 | $42,463 | $16,369 | $26,094 |
| 2016 | $1,013 | $42,463 | $16,369 | $26,094 |
| 2015 | $1,001 | $84,931 | $0 | $0 |
| 2014 | $769 | $42,465 | $0 | $0 |
| 2013 | $769 | $42,465 | $0 | $0 |
Source: Public Records
Map
Nearby Homes
Your Personal Tour Guide
Ask me questions while you tour the home.