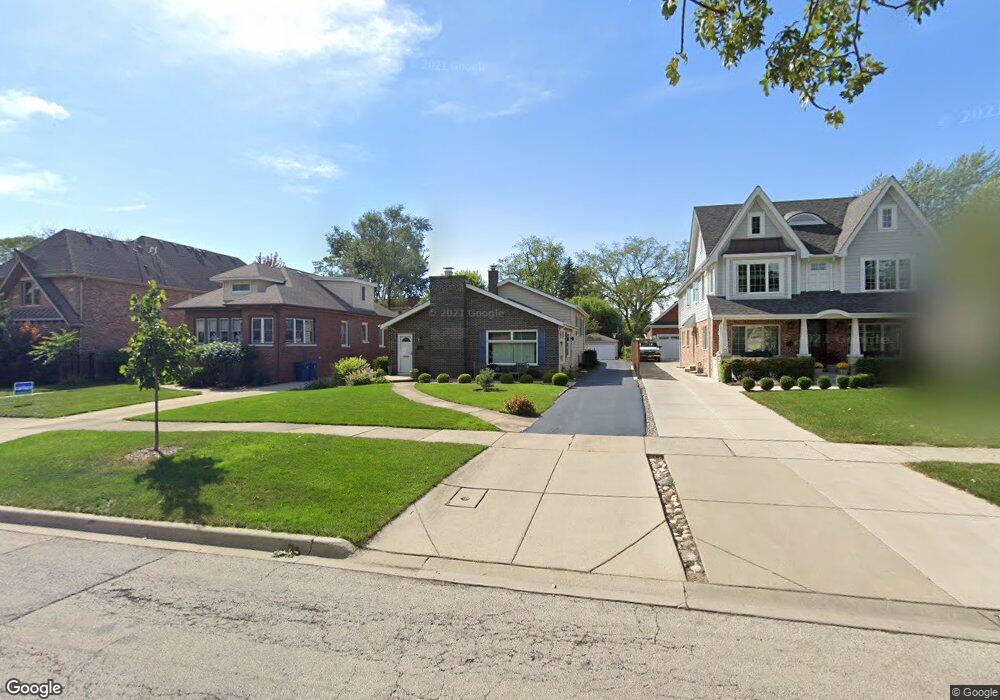
348 N Elm Ave Elmhurst, IL 60126
Estimated Value: $484,429 - $600,000
--
Bed
1
Bath
2,029
Sq Ft
$267/Sq Ft
Est. Value
About This Home
This home is located at 348 N Elm Ave, Elmhurst, IL 60126 and is currently estimated at $541,357, approximately $266 per square foot. 348 N Elm Ave is a home located in DuPage County with nearby schools including Emerson Elementary School, Churchville Middle School, and York Community High School.
Ownership History
Date
Name
Owned For
Owner Type
Purchase Details
Closed on
Dec 27, 2016
Sold by
Stanton Laura J and Stanton Reid L
Bought by
Stanton Reid L and Burnett Stanton Laura
Current Estimated Value
Purchase Details
Closed on
Mar 18, 2003
Sold by
Stanton Reid L and Burnett Stanton Laura
Bought by
Stanton Laura J
Home Financials for this Owner
Home Financials are based on the most recent Mortgage that was taken out on this home.
Original Mortgage
$110,000
Interest Rate
5.96%
Purchase Details
Closed on
Jul 27, 1998
Sold by
Stanton Reid L and Burnett Stanton Laura
Bought by
Stanton Reid L and Burnett Stanton Laura
Purchase Details
Closed on
Mar 17, 1995
Sold by
Obren Robert J
Bought by
Obrien Laura J
Home Financials for this Owner
Home Financials are based on the most recent Mortgage that was taken out on this home.
Original Mortgage
$130,000
Interest Rate
8.27%
Create a Home Valuation Report for This Property
The Home Valuation Report is an in-depth analysis detailing your home's value as well as a comparison with similar homes in the area
Home Values in the Area
Average Home Value in this Area
Purchase History
| Date | Buyer | Sale Price | Title Company |
|---|---|---|---|
| Stanton Reid L | -- | Attorney | |
| Stanton Laura J | -- | -- | |
| Stanton Reid L | -- | -- | |
| Obrien Laura J | -- | First American Title Ins Co |
Source: Public Records
Mortgage History
| Date | Status | Borrower | Loan Amount |
|---|---|---|---|
| Closed | Stanton Laura J | $110,000 | |
| Closed | Obrien Laura J | $130,000 |
Source: Public Records
Tax History Compared to Growth
Tax History
| Year | Tax Paid | Tax Assessment Tax Assessment Total Assessment is a certain percentage of the fair market value that is determined by local assessors to be the total taxable value of land and additions on the property. | Land | Improvement |
|---|---|---|---|---|
| 2024 | $8,089 | $148,082 | $70,816 | $77,266 |
| 2023 | $7,414 | $136,130 | $65,100 | $71,030 |
| 2022 | $7,305 | $130,260 | $62,300 | $67,960 |
| 2021 | $6,469 | $124,770 | $59,670 | $65,100 |
| 2020 | $6,550 | $119,510 | $57,150 | $62,360 |
| 2019 | $6,469 | $114,910 | $54,950 | $59,960 |
| 2018 | $6,047 | $107,550 | $52,340 | $55,210 |
| 2017 | $5,912 | $102,790 | $50,020 | $52,770 |
| 2016 | $5,967 | $94,900 | $46,180 | $48,720 |
| 2015 | $5,845 | $87,670 | $42,660 | $45,010 |
| 2014 | $5,416 | $75,560 | $35,200 | $40,360 |
| 2013 | $5,395 | $77,100 | $35,920 | $41,180 |
Source: Public Records
Map
Nearby Homes
- 314 N Elm Ave
- 456 N Elm Ave
- 262 N Addison Ave
- 251 W Armitage Ave
- 260 N Addison Ave
- 258 N Addison Ave
- 254 N Addison Ave
- 193 N Elm Ave
- 442 N Oak St
- 322 N Highland Ave
- 210 N Addison Ave Unit 202
- 195 N Addison Ave Unit PH03
- 284 N Highland Ave
- 407 W North Ave
- 183 E Grantley Ave
- 412 N Ridgeland Ave
- 285 N Ridgeland Ave
- 196 N Walnut St
- 286 N Indiana St
- 468 N Highland Ave
- 344 N Elm Ave
- 352 N Elm Ave
- 354 N Elm Ave
- 338 N Elm Ave
- 247 W Grantley Ave
- 360 N Elm Ave
- 253 W Grantley Ave
- 339 N Elm Ave
- 345 N Elm Ave
- 351 N Elm Ave
- 257 W Grantley Ave
- 355 N Elm Ave
- 359 N Elm Ave
- 366 N Elm Ave
- 261 W Grantley Ave
- 250 W Grantley Ave
- 331 N Elm Ave
- 252 W Grantley Ave
- 252 W Grantley Ave
- 365 N Elm Ave