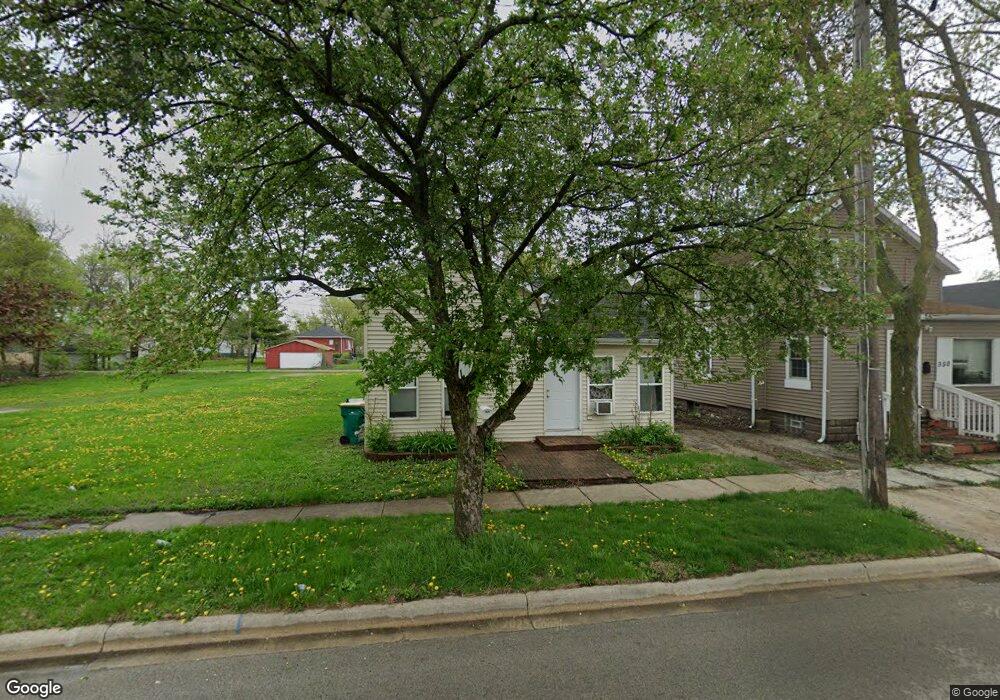
348 S Desplaines St Joliet, IL 60436
Southside Joliet NeighborhoodEstimated Value: $141,000 - $185,000
2
Beds
1
Bath
900
Sq Ft
$182/Sq Ft
Est. Value
About This Home
This home is located at 348 S Desplaines St, Joliet, IL 60436 and is currently estimated at $163,891, approximately $182 per square foot. 348 S Desplaines St is a home located in Will County with nearby schools including Edna Keith Elementary School, Washington Jr. High School and Academy, and Joliet Central High School.
Ownership History
Date
Name
Owned For
Owner Type
Purchase Details
Closed on
Sep 30, 2015
Sold by
Bergthold David A and Bergthold Tracy
Bought by
Corcoran Kristopher L
Current Estimated Value
Purchase Details
Closed on
Feb 22, 2012
Sold by
Federal Home Loan Mortgage Corporation
Bought by
Bergthold Tracy and Bergthold David
Purchase Details
Closed on
Aug 1, 2011
Sold by
Patel Prashant R
Bought by
Federal Home Loan Mortgage Corp
Purchase Details
Closed on
Sep 22, 2010
Sold by
Patel Prashant R
Bought by
Bac Home Loans Servicing Lp and Countrywide Home Loans Servicing Lp
Purchase Details
Closed on
May 16, 2007
Sold by
Spinks Irene
Bought by
Patel Prashant R
Home Financials for this Owner
Home Financials are based on the most recent Mortgage that was taken out on this home.
Original Mortgage
$66,350
Interest Rate
6.22%
Mortgage Type
Purchase Money Mortgage
Create a Home Valuation Report for This Property
The Home Valuation Report is an in-depth analysis detailing your home's value as well as a comparison with similar homes in the area
Home Values in the Area
Average Home Value in this Area
Purchase History
| Date | Buyer | Sale Price | Title Company |
|---|---|---|---|
| Corcoran Kristopher L | $26,000 | Fidelity National Title Ins | |
| Bergthold Tracy | $8,900 | Attorneys Title Guaranty Fun | |
| Federal Home Loan Mortgage Corp | -- | None Available | |
| Bac Home Loans Servicing Lp | $23,500 | None Available | |
| Patel Prashant R | $30,000 | Millennium Title Group |
Source: Public Records
Mortgage History
| Date | Status | Borrower | Loan Amount |
|---|---|---|---|
| Previous Owner | Patel Prashant R | $66,350 |
Source: Public Records
Tax History Compared to Growth
Tax History
| Year | Tax Paid | Tax Assessment Tax Assessment Total Assessment is a certain percentage of the fair market value that is determined by local assessors to be the total taxable value of land and additions on the property. | Land | Improvement |
|---|---|---|---|---|
| 2024 | $3,172 | $37,871 | $3,656 | $34,215 |
| 2023 | $3,172 | $33,648 | $3,248 | $30,400 |
| 2022 | $2,811 | $30,437 | $2,938 | $27,499 |
| 2021 | $2,672 | $28,427 | $2,744 | $25,683 |
| 2020 | $2,535 | $26,996 | $2,606 | $24,390 |
| 2019 | $2,411 | $25,089 | $2,422 | $22,667 |
| 2018 | $2,310 | $23,183 | $2,238 | $20,945 |
| 2017 | $2,177 | $21,078 | $2,035 | $19,043 |
| 2016 | $2,086 | $19,410 | $1,866 | $17,544 |
| 2015 | $1,970 | $18,200 | $1,750 | $16,450 |
| 2014 | $1,970 | $18,100 | $1,750 | $16,350 |
| 2013 | $1,970 | $18,913 | $1,965 | $16,948 |
Source: Public Records
Map
Nearby Homes
- 304 S Desplaines St
- 334 S Ottawa St
- 167 Wallace St
- 454 S Desplaines St
- 457 S Desplaines St
- 500 S Ottawa St
- 8 Osgood St
- 108 W Marion St
- 508 S Eastern Ave
- 516 S Eastern Ave
- 107 4th Ave
- 310 Pleasant St
- 411 Pleasant St
- 217 Sherman St
- 230 Comstock St
- 526 Gardner St
- 508 Mcdonough St
- 404 Sherman St
- 324 Illinois St
- 715 Water St
- 350 S Desplaines St
- 346 S Desplaines St
- 354 S Desplaines St
- 356 S Desplaines St
- 358 S Desplaines St
- 335 S Joliet St
- 339 S Joliet St
- 331 S Joliet St
- 360 S Desplaines St
- 330 S Desplaines St
- 330 S Desplaines St
- 345 S Joliet St
- 329 S Joliet St
- 327 S Joliet St
- 111 Mcdonough St
- 351 S Joliet St
- 324 S Desplaines St
- 349 S Joliet St
- 323 S Joliet St
- 334 S Joliet St