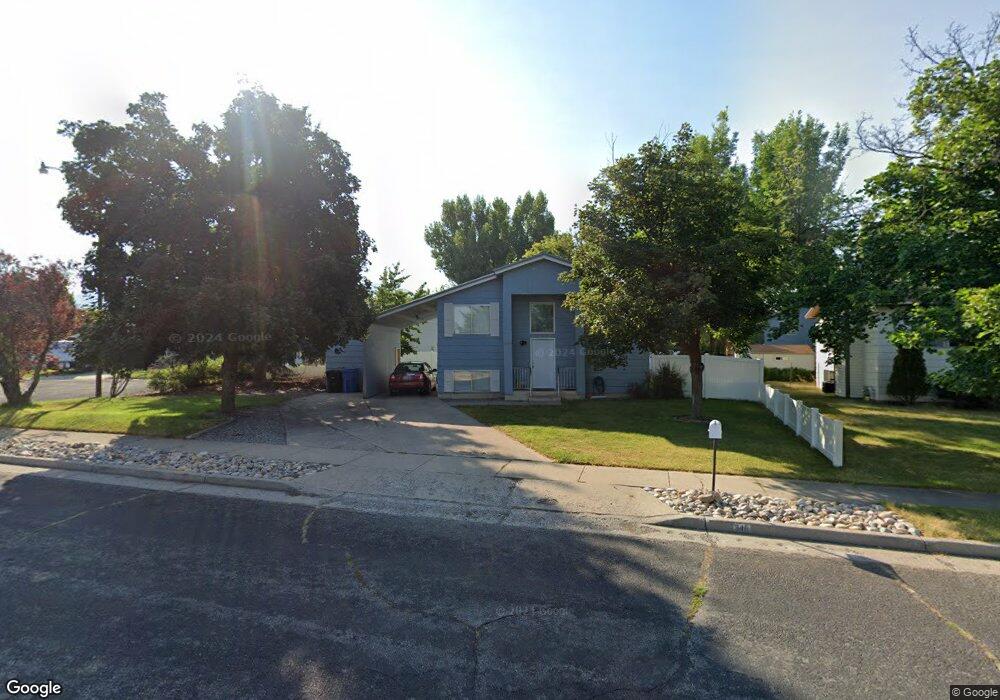
348 Willow Dr Logan, UT 84321
Woodruff NeighborhoodEstimated Value: $342,425 - $383,000
3
Beds
2
Baths
1,938
Sq Ft
$185/Sq Ft
Est. Value
About This Home
This home is located at 348 Willow Dr, Logan, UT 84321 and is currently estimated at $357,606, approximately $184 per square foot. 348 Willow Dr is a home located in Cache County with nearby schools including Woodruff School, Mount Logan Middle School, and Logan High School.
Ownership History
Date
Name
Owned For
Owner Type
Purchase Details
Closed on
Jan 4, 2021
Sold by
Groll Robert K
Bought by
Groll Robert K and Groll Klay E
Current Estimated Value
Purchase Details
Closed on
Jan 10, 2020
Sold by
Secretary Of Housing & Urban Development
Bought by
County Of Cache
Purchase Details
Closed on
Mar 15, 2018
Sold by
Etitle Ins Agy Llc
Bought by
Hud
Create a Home Valuation Report for This Property
The Home Valuation Report is an in-depth analysis detailing your home's value as well as a comparison with similar homes in the area
Home Values in the Area
Average Home Value in this Area
Purchase History
| Date | Buyer | Sale Price | Title Company |
|---|---|---|---|
| Groll Robert K | -- | Land Title | |
| County Of Cache | -- | Northern Title Company | |
| Hud | -- | -- |
Source: Public Records
Tax History
| Year | Tax Paid | Tax Assessment Tax Assessment Total Assessment is a certain percentage of the fair market value that is determined by local assessors to be the total taxable value of land and additions on the property. | Land | Improvement |
|---|---|---|---|---|
| 2025 | $1,545 | $199,820 | $0 | $0 |
| 2024 | $1,586 | $198,615 | $0 | $0 |
| 2023 | $1,638 | $195,550 | $0 | $0 |
| 2022 | $1,433 | $159,800 | $0 | $0 |
| 2021 | $1,358 | $233,880 | $45,000 | $188,880 |
| 2020 | $1,306 | $202,400 | $45,000 | $157,400 |
| 2019 | $1,153 | $170,948 | $45,000 | $125,948 |
| 2018 | $1,120 | $151,736 | $45,000 | $106,736 |
| 2017 | $1,016 | $72,765 | $0 | $0 |
| 2016 | $1,054 | $72,765 | $0 | $0 |
| 2015 | $1,055 | $72,765 | $0 | $0 |
| 2014 | $858 | $65,470 | $0 | $0 |
| 2013 | -- | $65,470 | $0 | $0 |
Source: Public Records
Map
Nearby Homes
- 1400 S 940 W
- 952 W 330 S
- 207 Sunstone Cir
- 501 Southwest St
- 1031 W 350 S
- 553 Center Ave
- 1099 Three Pointe Ave
- 562 S 1215 W Unit 135
- 370 S 1200 W Unit 2
- 226 S 600 W
- 508 S 1215 W Unit 144
- 539 S 1215 W Unit 129
- 551 S 1215 W Unit 131
- 1214 W 575 S
- 1204 W 575 S
- 1210 W 575 S Unit 163
- 1210 W 575 S
- 245 S 1280 W
- 1239 W 575 S
- 339 W Center St
Your Personal Tour Guide
Ask me questions while you tour the home.