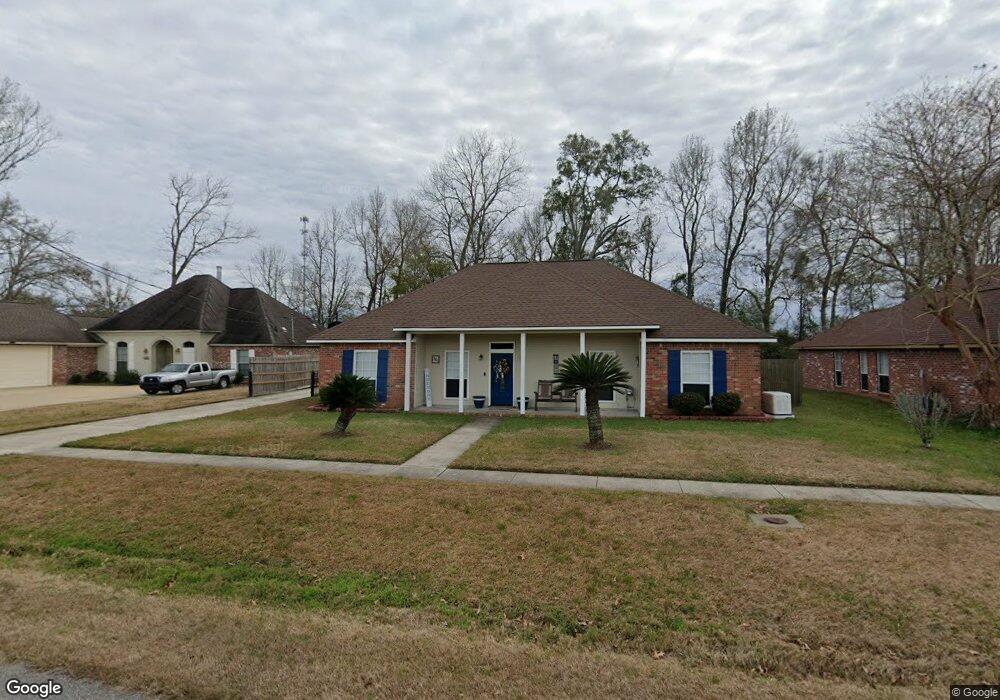
3480 Redbud St Zachary, LA 70791
Estimated Value: $231,000 - $248,000
3
Beds
2
Baths
1,822
Sq Ft
$133/Sq Ft
Est. Value
About This Home
This home is located at 3480 Redbud St, Zachary, LA 70791 and is currently estimated at $242,479, approximately $133 per square foot. 3480 Redbud St is a home located in East Baton Rouge Parish with nearby schools including Northwestern Elementary School, Rollins Place Elementary School, and Zachary Elementary School.
Ownership History
Date
Name
Owned For
Owner Type
Purchase Details
Closed on
Mar 23, 2007
Sold by
Vandiver Sean K
Bought by
Jones Alen C
Current Estimated Value
Home Financials for this Owner
Home Financials are based on the most recent Mortgage that was taken out on this home.
Original Mortgage
$164,500
Outstanding Balance
$99,569
Interest Rate
6.26%
Mortgage Type
New Conventional
Estimated Equity
$142,910
Create a Home Valuation Report for This Property
The Home Valuation Report is an in-depth analysis detailing your home's value as well as a comparison with similar homes in the area
Home Values in the Area
Average Home Value in this Area
Purchase History
| Date | Buyer | Sale Price | Title Company |
|---|---|---|---|
| Jones Alen C | $164,500 | -- |
Source: Public Records
Mortgage History
| Date | Status | Borrower | Loan Amount |
|---|---|---|---|
| Open | Jones Alen C | $164,500 |
Source: Public Records
Tax History Compared to Growth
Tax History
| Year | Tax Paid | Tax Assessment Tax Assessment Total Assessment is a certain percentage of the fair market value that is determined by local assessors to be the total taxable value of land and additions on the property. | Land | Improvement |
|---|---|---|---|---|
| 2024 | $1,709 | $20,650 | $2,400 | $18,250 |
| 2023 | $1,709 | $17,350 | $2,400 | $14,950 |
| 2022 | $2,176 | $17,350 | $2,400 | $14,950 |
| 2021 | $2,176 | $17,350 | $2,400 | $14,950 |
| 2020 | $2,196 | $17,350 | $2,400 | $14,950 |
| 2019 | $2,346 | $16,850 | $2,400 | $14,450 |
| 2018 | $2,355 | $16,850 | $2,400 | $14,450 |
| 2017 | $2,355 | $16,850 | $2,400 | $14,450 |
| 2016 | $1,320 | $16,850 | $2,400 | $14,450 |
| 2015 | $1,227 | $16,450 | $2,400 | $14,050 |
| 2014 | $1,223 | $16,450 | $2,400 | $14,050 |
| 2013 | -- | $16,450 | $2,400 | $14,050 |
Source: Public Records
Map
Nearby Homes
- 3243 Camelia St
- 3508 Ash St
- 3014 Camelia St
- 6647 Maple St
- 3411 Chien St
- 3420 Chien St
- 3430 Chien St
- 3421 Chien St
- 3410 Chien St
- 3440 Chien St
- 3542 Chien St
- 7043 Brook Hollow Dr
- 7003 Brook Hollow Dr
- 7013 Brook Hollow Dr
- 6961 Brook Hollow Dr
- 7023 Brook Hollow Dr
- Kenner Plan at Brook Hollow
- 3523 Chien St
- Lacombe Plan at Brook Hollow
- Ozark Plan at Brook Hollow