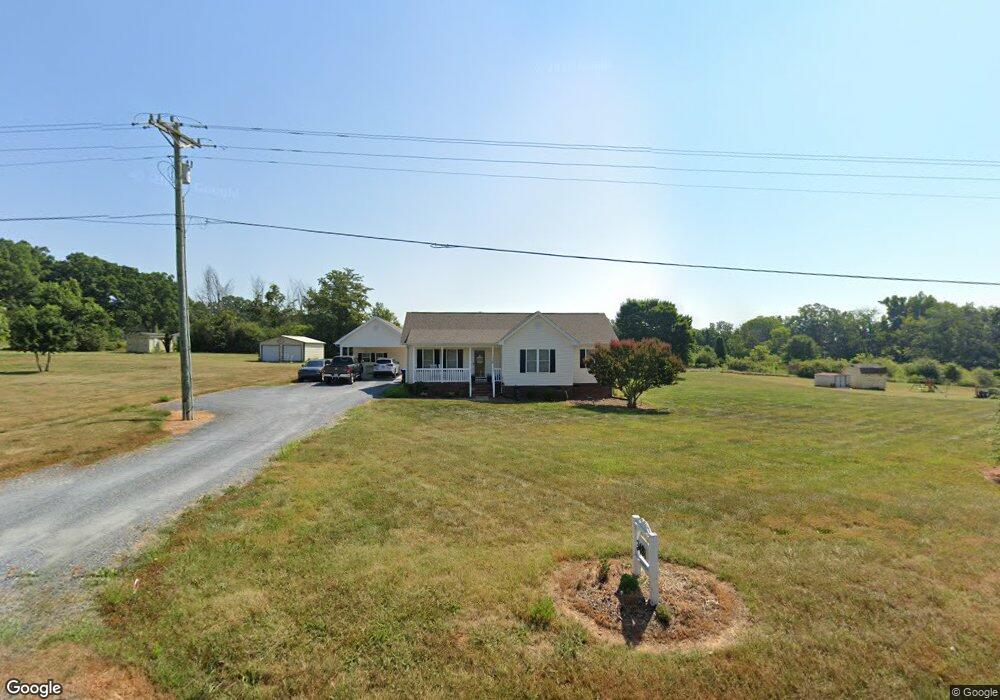
3481 Nc Highway 42 S Asheboro, NC 27205
Estimated Value: $228,573 - $284,000
--
Bed
2
Baths
1,257
Sq Ft
$206/Sq Ft
Est. Value
About This Home
This home is located at 3481 Nc Highway 42 S, Asheboro, NC 27205 and is currently estimated at $258,643, approximately $205 per square foot. 3481 Nc Highway 42 S is a home located in Randolph County with nearby schools including Coleridge Elementary School, Southeastern Randolph Middle School, and Eastern Randolph High School.
Ownership History
Date
Name
Owned For
Owner Type
Purchase Details
Closed on
Oct 24, 2024
Sold by
Powers Mcalister Patricia
Bought by
Leonard John Tyler and Leonard Alexis Gray
Current Estimated Value
Purchase Details
Closed on
Jul 28, 2020
Sold by
Kerns Marion Roberta Fox and Kerns Gene Caswell
Bought by
Gray Alexis B and Leonard John Tyler
Home Financials for this Owner
Home Financials are based on the most recent Mortgage that was taken out on this home.
Original Mortgage
$152,192
Interest Rate
3.1%
Mortgage Type
FHA
Purchase Details
Closed on
Jan 6, 2017
Sold by
Fox Marion M
Bought by
Fox Kerns Marion Roberta Fox and Fox Cagle Sandra
Purchase Details
Closed on
May 31, 2002
Bought by
Fox Marion M
Create a Home Valuation Report for This Property
The Home Valuation Report is an in-depth analysis detailing your home's value as well as a comparison with similar homes in the area
Home Values in the Area
Average Home Value in this Area
Purchase History
| Date | Buyer | Sale Price | Title Company |
|---|---|---|---|
| Leonard John Tyler | -- | None Listed On Document | |
| Tyler Leonard John | -- | None Listed On Document | |
| Gray Alexis B | $155,000 | None Available | |
| Fox Kerns Marion Roberta Fox | $2,500 | None Available | |
| Fox Marion M | $16,500 | -- |
Source: Public Records
Mortgage History
| Date | Status | Borrower | Loan Amount |
|---|---|---|---|
| Previous Owner | Gray Alexis B | $152,192 |
Source: Public Records
Tax History Compared to Growth
Tax History
| Year | Tax Paid | Tax Assessment Tax Assessment Total Assessment is a certain percentage of the fair market value that is determined by local assessors to be the total taxable value of land and additions on the property. | Land | Improvement |
|---|---|---|---|---|
| 2025 | $1,203 | $179,560 | $38,980 | $140,580 |
| 2024 | $1,167 | $179,560 | $38,980 | $140,580 |
| 2023 | $1,167 | $179,560 | $38,980 | $140,580 |
| 2022 | $958 | $122,440 | $20,650 | $101,790 |
| 2021 | $958 | $122,440 | $20,650 | $101,790 |
| 2020 | $924 | $120,390 | $20,650 | $99,740 |
| 2019 | $924 | $120,390 | $20,650 | $99,740 |
| 2018 | $859 | $109,140 | $18,590 | $90,550 |
| 2016 | $426 | $109,139 | $18,590 | $90,549 |
| 2015 | $428 | $109,139 | $18,590 | $90,549 |
| 2014 | -- | $109,139 | $18,590 | $90,549 |
Source: Public Records
Map
Nearby Homes
- 3961 N Carolina 42
- 3963 N Carolina 42
- 2132 Sunbeam Ct
- 4417 Nc Highway 42 S
- 4417 N Carolina 42
- 3158 Cane Mill Rd
- 1773 Winchester Heights Dr
- 1767 Winchester Heights Dr
- 2192 N Carolina 42
- 3736 Buffalo Ford Rd
- 3643 Buffalo Ford Rd
- 1737 Woodglo Dr
- 3828 Zoo Pkwy
- 4263 Zoo Pkwy
- 0 Nc Highway 42 S Unit 1181762
- 942 Ponderosa Heights Place
- 920 Ponderosa Heights Place
- 677 Kennedy Country Dr
- 0 Old Nc Highway 13 Unit 1172458
- 4242 Woodfern Rd
- 3499 Nc Highway 42 S
- 3457 Nc Highway 42 S
- 3502 Nc Highway 42 S
- 3505 Nc Highway 42 S
- 3401 Nc Highway 42 S
- 2442 Linnie Ct
- 2430 Linnie Ct
- 2550 Cordie Dr
- 2544 Cordie Dr
- 2556 Cordie Dr
- 2568 Cordie Dr
- 2662 Hayfield Dr
- 2656 Hayfield Dr
- 2678 Hayfield Dr
- 2630 Hayfield Dr
- 2576 Cordie Dr
- 2547 Cordie Dr Unit 53
- 2547 Cordie Dr
- 2470 Linnie Ct
- 2429 Linnie Ct