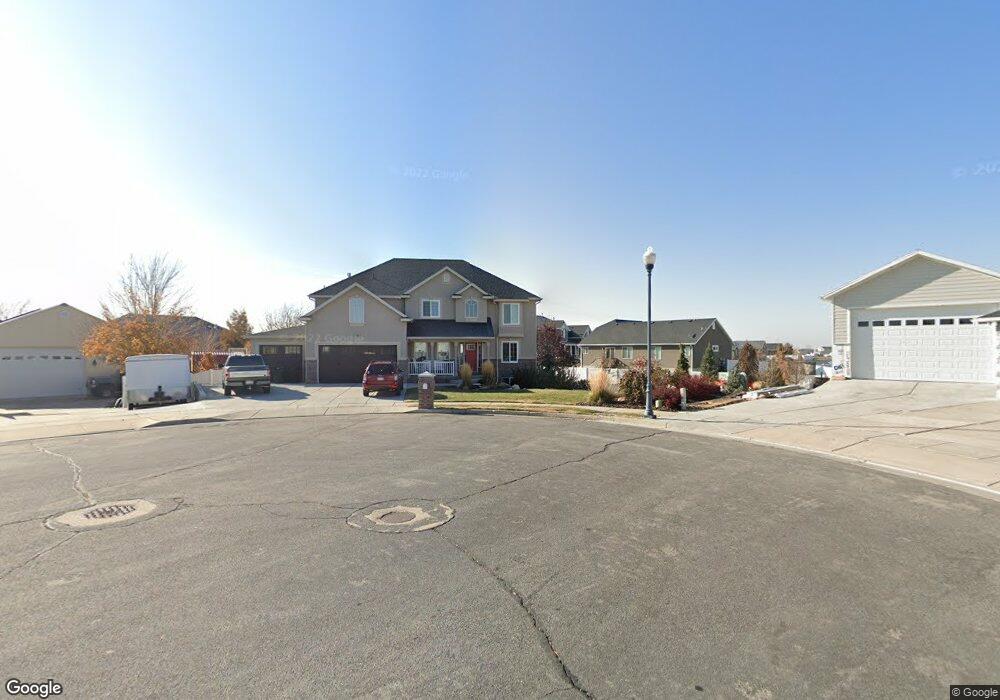
3481 W 1580 N Clearfield, UT 84015
Estimated Value: $716,107 - $847,000
6
Beds
3
Baths
4,488
Sq Ft
$172/Sq Ft
Est. Value
About This Home
This home is located at 3481 W 1580 N, Clearfield, UT 84015 and is currently estimated at $773,777, approximately $172 per square foot. 3481 W 1580 N is a home located in Davis County with nearby schools including West Point School, West Point Junior High School, and Syracuse High School.
Ownership History
Date
Name
Owned For
Owner Type
Purchase Details
Closed on
Feb 2, 2010
Sold by
Delong Samuel J
Bought by
Delong Samuel J and Delong Mellissa E
Current Estimated Value
Home Financials for this Owner
Home Financials are based on the most recent Mortgage that was taken out on this home.
Original Mortgage
$290,638
Outstanding Balance
$190,433
Interest Rate
4.91%
Mortgage Type
FHA
Estimated Equity
$583,344
Purchase Details
Closed on
Feb 1, 2010
Sold by
Johnson Darrin K and Johnson Stephanie
Bought by
Delong Samuel J
Home Financials for this Owner
Home Financials are based on the most recent Mortgage that was taken out on this home.
Original Mortgage
$290,638
Outstanding Balance
$190,433
Interest Rate
4.91%
Mortgage Type
FHA
Estimated Equity
$583,344
Purchase Details
Closed on
Feb 10, 2003
Sold by
Fong Leonard K M
Bought by
Johnson Darrin K and Johnson Stephanie
Create a Home Valuation Report for This Property
The Home Valuation Report is an in-depth analysis detailing your home's value as well as a comparison with similar homes in the area
Home Values in the Area
Average Home Value in this Area
Purchase History
| Date | Buyer | Sale Price | Title Company |
|---|---|---|---|
| Delong Samuel J | -- | Accommodation | |
| Delong Samuel J | -- | Utah Commercial Title Co | |
| Johnson Darrin K | -- | Meridian Title Company |
Source: Public Records
Mortgage History
| Date | Status | Borrower | Loan Amount |
|---|---|---|---|
| Open | Delong Samuel J | $290,638 |
Source: Public Records
Tax History Compared to Growth
Tax History
| Year | Tax Paid | Tax Assessment Tax Assessment Total Assessment is a certain percentage of the fair market value that is determined by local assessors to be the total taxable value of land and additions on the property. | Land | Improvement |
|---|---|---|---|---|
| 2025 | $3,993 | $383,900 | $133,862 | $250,038 |
| 2024 | $3,579 | $345,950 | $142,474 | $203,476 |
| 2023 | $3,411 | $610,000 | $170,355 | $439,645 |
| 2022 | $3,630 | $359,150 | $94,353 | $264,797 |
| 2021 | $3,427 | $503,000 | $135,080 | $367,920 |
| 2020 | $3,016 | $438,000 | $124,792 | $313,208 |
| 2019 | $2,967 | $421,000 | $127,709 | $293,291 |
| 2018 | $2,747 | $383,000 | $105,682 | $277,318 |
| 2016 | $2,491 | $179,300 | $43,072 | $136,228 |
| 2015 | $2,538 | $173,690 | $43,072 | $130,618 |
| 2014 | $2,390 | $166,149 | $43,072 | $123,077 |
| 2013 | -- | $154,126 | $36,812 | $117,314 |
Source: Public Records
Map
Nearby Homes
- 3168 W 1300 N
- 3892 W 1450 N
- 2413 N Eurasian Crane Rd
- 3941 W 1800 N
- 2959 W 1300 N
- 2921 W 1300 N
- 2118 Snowy Crane Dr
- 1172 N 3000 W
- 4061 W 1250 N Unit 1250
- Torino Farmhouse Plan at Cranefield Estates
- 1700 Farmhouse Plan at Cranefield Estates - Estates Collection
- 2000 Traditional Plan at Cranefield Estates - Estates Collection
- Murano Traditional Plan at Cranefield Estates - Estates Collection
- 2400 Farmhouse Plan at Cranefield Estates - Estates Collection
- 1825 Traditional Plan at Cranefield Estates - Estates Collection
- 1550 Craftsman Plan at Cranefield Estates - Estates Collection
- 2050 Craftsman Plan at Cranefield Estates - Estates Collection
- Murano Traditional Plan at Cranefield Estates
- 2000 Farmhouse Plan at Cranefield Estates - Estates Collection
- 2500 Traditional Plan at Cranefield Estates - Estates Collection
- 3481 W 1580 N Unit 47
- 3512 W 1550 N
- 3469 W 1580 N
- 3469 W 1580 N Unit 48
- 3488 W 1500 N
- 3488 W 1500 N Unit 52
- 3488 W 1580 N
- 3516 W 1550 N
- 3464 W 1500 N
- 3464 W 1500 N Unit 51
- 3502 W 1500 N
- 3464 W 1580 N
- 1551 N 3420 W
- 3531 W 1550 N
- 3516 W 1500 N
- 3526 W 1550 N
- 3519 W 1600 N
- 3436 W 1580 N
- 3442 W 1500 N
- 3508 W 1600 N