Estimated Value: $463,000 - $500,092
4
Beds
3
Baths
1,342
Sq Ft
$361/Sq Ft
Est. Value
About This Home
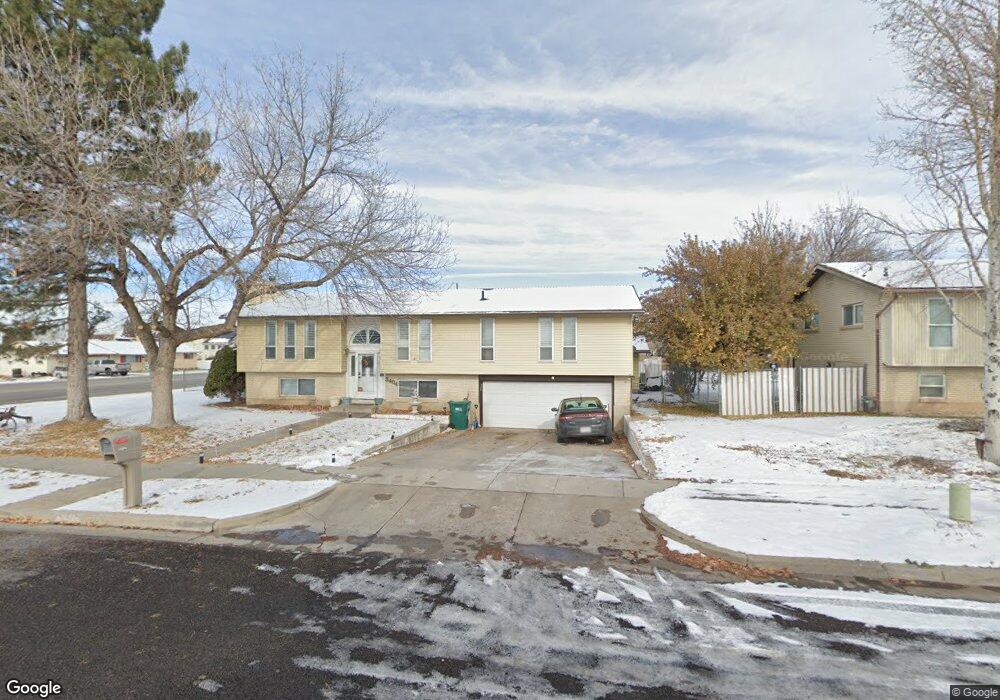
This home is located at 3484 W 5300 S, Roy, UT 84067 and is currently estimated at $484,023, approximately $360 per square foot. 3484 W 5300 S is a home located in Weber County with nearby schools including Roy Elementary School, Roy Junior High School, and Roy High School.
Ownership History
Date
Name
Owned For
Owner Type
Purchase Details
Closed on
Mar 25, 2022
Sold by
Clarence And Elois Kelley Family Living
Bought by
Harger Danny and Harger Leslie
Current Estimated Value
Home Financials for this Owner
Home Financials are based on the most recent Mortgage that was taken out on this home.
Original Mortgage
$332,800
Outstanding Balance
$312,643
Interest Rate
4.42%
Estimated Equity
$171,380
Purchase Details
Closed on
Jul 8, 2010
Sold by
Kelley Clarence L and Kelley Elois L
Bought by
Kelley Clarence L and Kelley Elois L
Create a Home Valuation Report for This Property
The Home Valuation Report is an in-depth analysis detailing your home's value as well as a comparison with similar homes in the area
Home Values in the Area
Average Home Value in this Area
Purchase History
| Date | Buyer | Sale Price | Title Company |
|---|---|---|---|
| Harger Danny | -- | Old Republic Title | |
| Kelley Clarence L | -- | None Available |
Source: Public Records
Mortgage History
| Date | Status | Borrower | Loan Amount |
|---|---|---|---|
| Open | Harger Danny | $332,800 |
Source: Public Records
Tax History Compared to Growth
Tax History
| Year | Tax Paid | Tax Assessment Tax Assessment Total Assessment is a certain percentage of the fair market value that is determined by local assessors to be the total taxable value of land and additions on the property. | Land | Improvement |
|---|---|---|---|---|
| 2025 | $3,059 | $470,294 | $130,205 | $340,089 |
| 2024 | $2,994 | $254,098 | $71,612 | $182,486 |
| 2023 | $2,906 | $246,950 | $71,453 | $175,497 |
| 2022 | $2,746 | $237,050 | $58,824 | $178,226 |
| 2021 | $1,145 | $341,000 | $79,063 | $261,937 |
| 2020 | $991 | $278,001 | $79,063 | $198,938 |
| 2019 | $2,051 | $250,001 | $51,230 | $198,771 |
| 2018 | $872 | $232,000 | $46,557 | $185,443 |
| 2017 | $1,724 | $199,999 | $50,061 | $149,938 |
| 2016 | $1,545 | $95,651 | $24,743 | $70,908 |
| 2015 | $1,477 | $90,306 | $24,743 | $65,563 |
| 2014 | $1,499 | $90,263 | $24,743 | $65,520 |
Source: Public Records
Map
Nearby Homes
- 3443 W 5200 S Unit 2&3
- 3607 W 5400 S
- 5578 S 3450 W
- 3766 W 5300 S
- 5321 S 3100 W
- 4964 S 3375 W
- 5432 S 3150 W
- 5538 S 3150 W
- 3509 W 4835 S Unit 26
- 3523 W 4835 S Unit 28
- 3186 W 5625 S
- 3524 W 4835 S Unit 22
- 3176 W 5625 S
- Poplar Plan at Highgate Cove
- Pando Plan at Highgate Cove
- 3166 W 5625 S
- 3820 Foxglen Dr
- 3809 W 5625 S
- 3832 W 5625 S
- 5235 Midland Dr