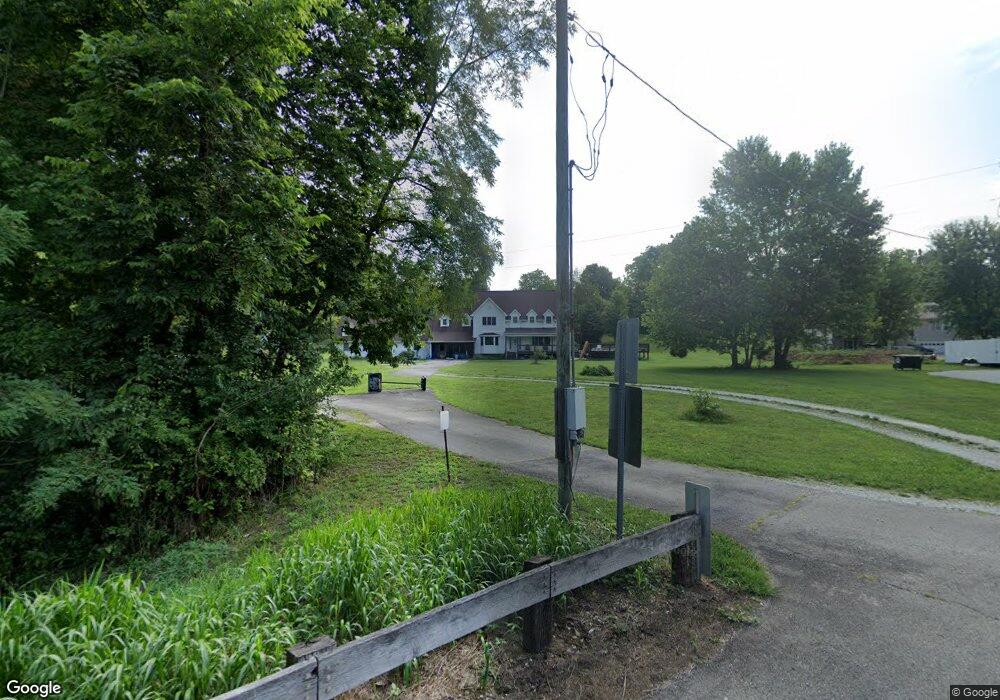
3484 W Laytons Dr Westport, IN 47283
Estimated Value: $435,000 - $618,665
5
Beds
4
Baths
3,832
Sq Ft
$131/Sq Ft
Est. Value
About This Home
This home is located at 3484 W Laytons Dr, Westport, IN 47283 and is currently estimated at $501,222, approximately $130 per square foot. 3484 W Laytons Dr is a home located in Decatur County with nearby schools including South Decatur Elementary School and South Decatur Junior/Senior High School.
Ownership History
Date
Name
Owned For
Owner Type
Purchase Details
Closed on
Oct 8, 2022
Sold by
Reynolds Stephanie K and Reynolds Wendell D
Bought by
Reynolds Dwayne Wendell and Reynolds Wendell D
Current Estimated Value
Home Financials for this Owner
Home Financials are based on the most recent Mortgage that was taken out on this home.
Original Mortgage
$427,350
Outstanding Balance
$405,920
Interest Rate
4.38%
Mortgage Type
FHA
Estimated Equity
$95,302
Purchase Details
Closed on
Dec 31, 2020
Sold by
Reynolds Stephanie and Reynolds Dwayne W
Bought by
Reynolds Stephanie K and Reynolds Dwayne W
Purchase Details
Closed on
Jul 12, 2019
Sold by
Louden Nathan A
Bought by
Kohlman Stephanie K and Wendell-Reynolds Dwayne
Home Financials for this Owner
Home Financials are based on the most recent Mortgage that was taken out on this home.
Original Mortgage
$265,050
Interest Rate
3.82%
Mortgage Type
New Conventional
Purchase Details
Closed on
Jul 9, 2014
Sold by
Steven A Steven A and Kearney Penny L
Bought by
Kearney Steven A and Kearney Penny L
Create a Home Valuation Report for This Property
The Home Valuation Report is an in-depth analysis detailing your home's value as well as a comparison with similar homes in the area
Home Values in the Area
Average Home Value in this Area
Purchase History
| Date | Buyer | Sale Price | Title Company |
|---|---|---|---|
| Reynolds Dwayne Wendell | -- | None Listed On Document | |
| Reynolds Stephanie K | -- | None Available | |
| Kohlman Stephanie K | -- | -- | |
| Kearney Steven A | -- | -- |
Source: Public Records
Mortgage History
| Date | Status | Borrower | Loan Amount |
|---|---|---|---|
| Open | Reynolds Dwayne Wendell | $427,350 | |
| Previous Owner | Kohlman Stephanie K | $265,050 |
Source: Public Records
Tax History Compared to Growth
Tax History
| Year | Tax Paid | Tax Assessment Tax Assessment Total Assessment is a certain percentage of the fair market value that is determined by local assessors to be the total taxable value of land and additions on the property. | Land | Improvement |
|---|---|---|---|---|
| 2024 | $2,265 | $525,300 | $29,100 | $496,200 |
| 2023 | $2,185 | $502,600 | $29,100 | $473,500 |
| 2022 | $2,155 | $466,400 | $29,100 | $437,300 |
| 2021 | $2,123 | $403,200 | $29,100 | $374,100 |
| 2020 | $1,975 | $263,200 | $27,400 | $235,800 |
| 2019 | $1,694 | $232,300 | $27,400 | $204,900 |
| 2018 | $1,504 | $237,700 | $27,400 | $210,300 |
| 2017 | $1,432 | $241,200 | $27,400 | $213,800 |
| 2016 | $1,374 | $236,700 | $25,300 | $211,400 |
| 2014 | $1,422 | $231,200 | $25,300 | $205,900 |
Source: Public Records
Map
Nearby Homes
- 0 W Co Rd 1100 S
- 3058 W Co Road 1100 S
- 3852 W Co Road 1100 S
- 11182 S County Road 280 W
- 11182 S Co Road 280 W
- 503 E Bennett St
- 506 E North St
- 312 E Sycamore St
- 217 E Sycamore St
- 508 Deer Run
- 107 W Main St
- 1017 W Main St
- 6440 W County Road 1300 S
- 7962 S State Road 3
- 6255 E County Road 850 N
- 6838 S Mill St
- 9901 W County Road 500 N
- 0 W County Road 500 Tract 1 N
- 0 W County Road 500 N Unit LotWP002
- 0 W County Road 500 N Unit 24458087
- 3484 W Laytons Dr
- 3484 W Laytons Dr
- 3476 W Laytons Dr
- 3640 W Laytons Dr
- 3456 W County Road 1100 S
- 3488 W Laytons Dr
- 3514 W Laytons Dr
- 3500 W Laytons Dr
- 3601 W Laytons Dr
- 3242 W County Road 1100 S
- 3680 W Laytons Dr
- 3700 W Layton Dr
- 3748 W Laytons Dr
- W Layton Dr
- 3064 W County Road 1100 S
- 3786 W Laytons Dr
- 3060 W Co Road 1100 S
- 3094 W County Road 1100 S
- 3062 W County Road 1100 S
- 3060 W County Road 1100 S