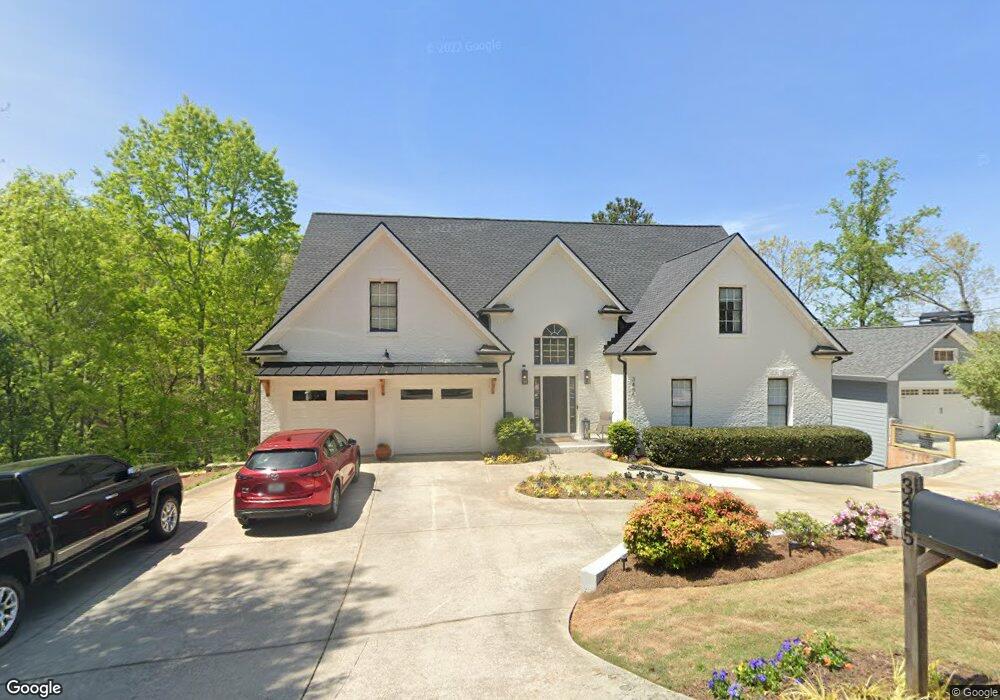
3485 Shoreland Dr Buford, GA 30518
Estimated Value: $742,000 - $911,000
4
Beds
4
Baths
2,030
Sq Ft
$421/Sq Ft
Est. Value
About This Home
This home is located at 3485 Shoreland Dr, Buford, GA 30518 and is currently estimated at $854,590, approximately $420 per square foot. 3485 Shoreland Dr is a home located in Hall County with nearby schools including Friendship Elementary School, C.W. Davis Middle School, and Flowery Branch High School.
Ownership History
Date
Name
Owned For
Owner Type
Purchase Details
Closed on
Jan 29, 2025
Sold by
Graff Corey James
Bought by
Graff Jennifer Trust
Current Estimated Value
Purchase Details
Closed on
Mar 17, 2015
Sold by
Atlas Ga Iii Spe Llc
Bought by
Graff Corey James and Graff Jennifer Whitney
Home Financials for this Owner
Home Financials are based on the most recent Mortgage that was taken out on this home.
Original Mortgage
$323,000
Interest Rate
3.87%
Mortgage Type
New Conventional
Purchase Details
Closed on
Dec 1, 2014
Sold by
Schulman Annett C
Bought by
Atlas Ga Iii Spe Llc And Branch Banking
Purchase Details
Closed on
Jun 20, 2012
Sold by
Atlas Ga Iii Spe Llc
Bought by
Schulman Annett C
Purchase Details
Closed on
May 1, 2012
Sold by
Schulman Annette C
Bought by
Atlas Ga Iii Spe Llc and C/O Property Tax Compliance
Create a Home Valuation Report for This Property
The Home Valuation Report is an in-depth analysis detailing your home's value as well as a comparison with similar homes in the area
Home Values in the Area
Average Home Value in this Area
Purchase History
| Date | Buyer | Sale Price | Title Company |
|---|---|---|---|
| Graff Jennifer Trust | -- | -- | |
| Graff Corey James | $340,000 | -- | |
| Corey Graff James | $135,000 | -- | |
| Atlas Ga Iii Spe Llc And Branch Banking | -- | -- | |
| Schulman Annett C | -- | -- | |
| Atlas Ga Iii Spe Llc | $400,000 | -- |
Source: Public Records
Mortgage History
| Date | Status | Borrower | Loan Amount |
|---|---|---|---|
| Previous Owner | Corey Graff James | $323,000 |
Source: Public Records
Tax History Compared to Growth
Tax History
| Year | Tax Paid | Tax Assessment Tax Assessment Total Assessment is a certain percentage of the fair market value that is determined by local assessors to be the total taxable value of land and additions on the property. | Land | Improvement |
|---|---|---|---|---|
| 2024 | $7,056 | $284,880 | $39,240 | $245,640 |
| 2023 | $6,445 | $276,000 | $39,240 | $236,760 |
| 2022 | $5,546 | $214,640 | $36,920 | $177,720 |
| 2021 | $5,596 | $212,600 | $36,920 | $175,680 |
| 2020 | $5,603 | $206,800 | $36,920 | $169,880 |
| 2019 | $5,491 | $200,840 | $36,920 | $163,920 |
| 2018 | $5,339 | $189,000 | $31,320 | $157,680 |
| 2017 | $4,562 | $163,120 | $20,560 | $142,560 |
| 2016 | $3,715 | $163,120 | $20,560 | $142,560 |
| 2015 | $4,392 | $199,520 | $36,600 | $162,920 |
| 2014 | $4,392 | $199,520 | $36,600 | $162,920 |
Source: Public Records
Map
Nearby Homes
- 3441 Shoreland Dr
- 6313 Shoreland Cir
- 3617 Shoreland Dr
- 6111 Blackberry Ln
- 6095 Blackberry Ln
- 6181 Shoreland Cir
- 6120 Hutchins Dr
- 6132 Hutchins Dr
- 3374 Lee Dr
- 3394 Lee Dr
- 5989 Lanier Islands Pkwy
- 3180 Lee Dr
- 6205 Bridgewood Dr
- 6225 Bridgewood Dr
- 5885 Bay View Dr
- 5862 Bay View Dr
- 6119 Bethany View Trail
- 3475 Shoreland Dr
- 3465 Shoreland Dr
- 3489 Shoreland Dr
- 3456 Shoreland Dr
- 3493 Shoreland Dr
- 3455 Shoreland Dr
- 3445 Shoreland Dr
- 3375 N Waterworks Rd
- 3527 Shoreland Dr
- 3395 N Waterworks Rd
- 3395 LOT 1 N Waterworks Rd
- 3395 LOT 4 N Waterworks Rd
- 3395 LOT 3 N Waterworks Rd
- 3508 Shoreland Dr
- 3508 Shoreland Dr Unit .
- 3510 Shoreland Dr
- 3651 Shoreland Dr
- 3398 Shoreland Dr
- 3655 Shoreland Dr
- 3512 Shoreland Dr