Estimated Value: $450,000 - $489,000
3
Beds
2
Baths
1,942
Sq Ft
$240/Sq Ft
Est. Value
About This Home
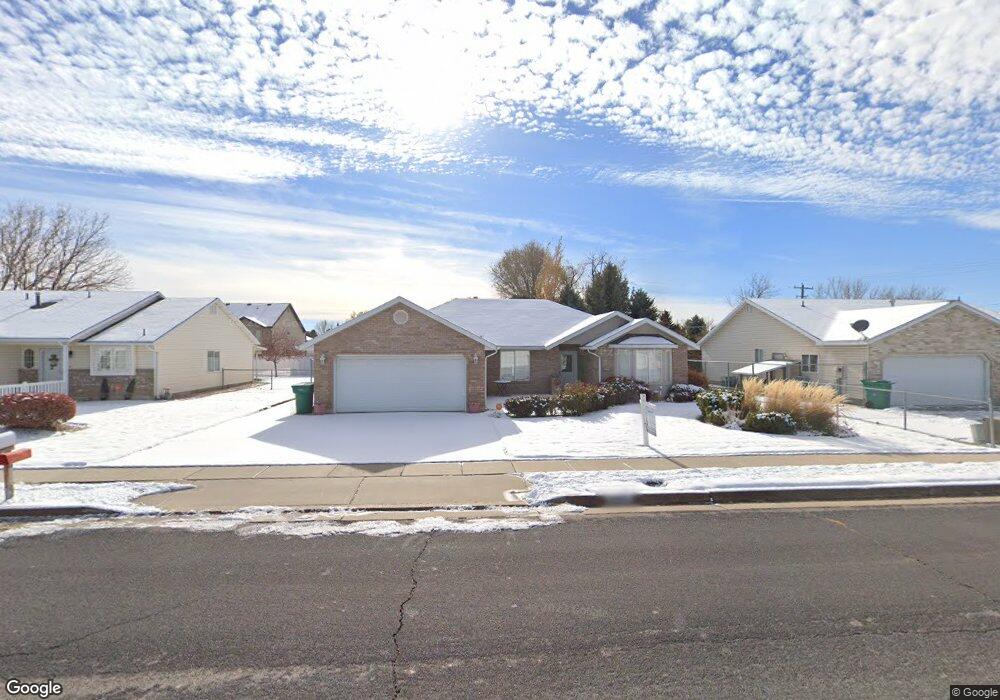
This home is located at 3485 W 5100 S, Roy, UT 84067 and is currently estimated at $466,533, approximately $240 per square foot. 3485 W 5100 S is a home located in Weber County with nearby schools including Midland School, Sand Ridge Junior High School, and Roy High School.
Ownership History
Date
Name
Owned For
Owner Type
Purchase Details
Closed on
Mar 20, 2023
Sold by
Carole Sevy Family Trust
Bought by
Neville Mark A and Neville Teresa
Current Estimated Value
Purchase Details
Closed on
Apr 16, 2014
Sold by
Sevy Carole D
Bought by
Sevy Carole
Purchase Details
Closed on
Apr 18, 1997
Sold by
Nelson Kevin
Bought by
Sevy Ward L and Sevy Carole D
Home Financials for this Owner
Home Financials are based on the most recent Mortgage that was taken out on this home.
Original Mortgage
$75,000
Interest Rate
7.86%
Purchase Details
Closed on
Jan 25, 1996
Sold by
Backus William B and Backus Earl Gregory
Bought by
Kevin Nelson Construction Company
Home Financials for this Owner
Home Financials are based on the most recent Mortgage that was taken out on this home.
Original Mortgage
$24,900
Interest Rate
6.99%
Mortgage Type
Seller Take Back
Create a Home Valuation Report for This Property
The Home Valuation Report is an in-depth analysis detailing your home's value as well as a comparison with similar homes in the area
Home Values in the Area
Average Home Value in this Area
Purchase History
| Date | Buyer | Sale Price | Title Company |
|---|---|---|---|
| Neville Mark A | -- | Old Republic Title | |
| Sevy Carole | -- | None Available | |
| Sevy Ward L | -- | Bonneville Title | |
| Kevin Nelson Construction Company | -- | Bonneville Title |
Source: Public Records
Mortgage History
| Date | Status | Borrower | Loan Amount |
|---|---|---|---|
| Previous Owner | Sevy Ward L | $75,000 | |
| Previous Owner | Kevin Nelson Construction Company | $24,900 |
Source: Public Records
Tax History
| Year | Tax Paid | Tax Assessment Tax Assessment Total Assessment is a certain percentage of the fair market value that is determined by local assessors to be the total taxable value of land and additions on the property. | Land | Improvement |
|---|---|---|---|---|
| 2025 | $2,803 | $447,613 | $135,000 | $312,613 |
| 2024 | $2,736 | $241,999 | $74,256 | $167,743 |
| 2023 | $2,571 | $227,150 | $65,864 | $161,286 |
| 2022 | $228 | $256,850 | $60,501 | $196,349 |
| 2021 | $208 | $329,000 | $79,963 | $249,037 |
| 2020 | $190 | $293,000 | $79,963 | $213,037 |
| 2019 | $190 | $278,000 | $44,976 | $233,024 |
| 2018 | $190 | $246,000 | $40,002 | $205,998 |
| 2017 | $190 | $202,000 | $40,002 | $161,998 |
| 2016 | $188 | $106,819 | $21,944 | $84,875 |
| 2015 | $186 | $98,846 | $21,944 | $76,902 |
| 2014 | $184 | $96,748 | $21,944 | $74,804 |
Source: Public Records
Map
Nearby Homes
- 3443 W 5200 S Unit 2&3
- 3509 W 4835 S Unit 26
- 3517 W 4835 S Unit 27
- 5155 S 3200 W
- 5321 S 3100 W
- 4813 S 3850 W
- 4950 3900 West St
- 5304 S 3100 W
- 5141 S 2975 W
- 5412 S 3925 W
- 3405 W 4525 S
- 5529 S 3200 W
- 5009 S 2925 W
- 4793 S 3025 W
- 4510 Stone Creek Rd Unit F
- 4491 Haven Creek Rd Unit A
- 3937 W 4650 S
- 4096 W 5075 S
- 3022 W 4750 S
- 4891 S 2875 W
Your Personal Tour Guide
Ask me questions while you tour the home.