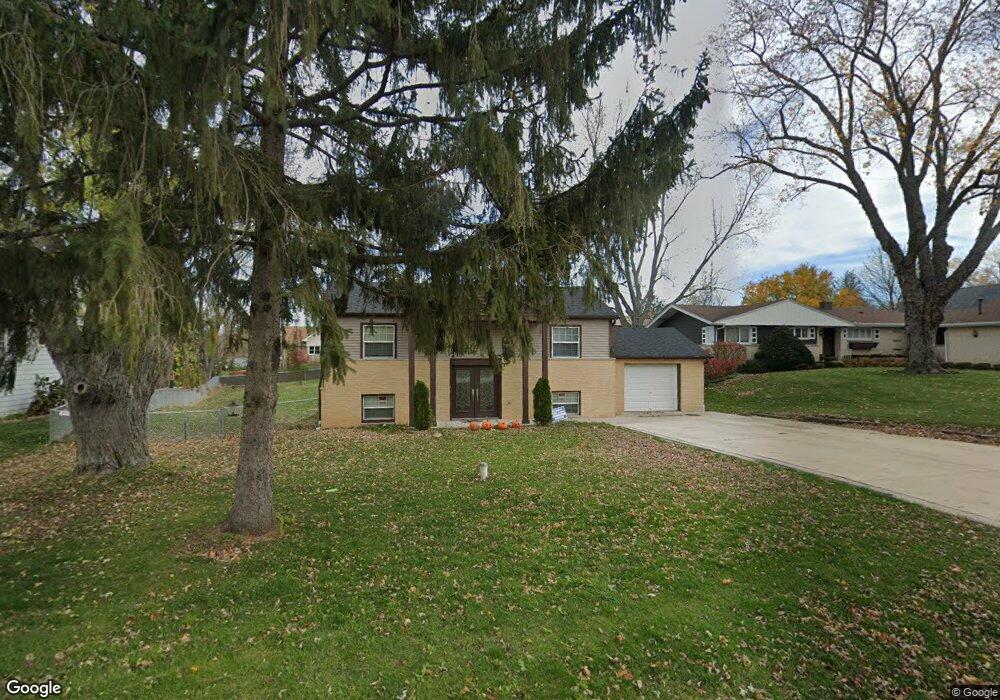
34863 N Leonard Ave Ingleside, IL 60041
East Palm Beach NeighborhoodEstimated Value: $267,000 - $316,000
4
Beds
2
Baths
1,619
Sq Ft
$181/Sq Ft
Est. Value
About This Home
This home is located at 34863 N Leonard Ave, Ingleside, IL 60041 and is currently estimated at $293,340, approximately $181 per square foot. 34863 N Leonard Ave is a home located in Lake County with nearby schools including Big Hollow Primary School, Big Hollow Elementary School, and Big Hollow Middle School.
Ownership History
Date
Name
Owned For
Owner Type
Purchase Details
Closed on
Oct 12, 2017
Sold by
Topp Loretta S
Bought by
Mayenschein Laura R and Mayenschein Heather R
Current Estimated Value
Home Financials for this Owner
Home Financials are based on the most recent Mortgage that was taken out on this home.
Original Mortgage
$161,029
Outstanding Balance
$134,251
Interest Rate
3.75%
Mortgage Type
FHA
Estimated Equity
$159,089
Purchase Details
Closed on
Sep 16, 2008
Sold by
Wells Fargo Bank Na
Bought by
Topp Loretta S
Purchase Details
Closed on
Apr 16, 2008
Sold by
Simon
Bought by
Wells Fargo Bank Na and Hsbc Bank Usa Na
Purchase Details
Closed on
Nov 23, 1999
Sold by
Butler James R and Butler Barbara S
Bought by
Simon Michael J
Home Financials for this Owner
Home Financials are based on the most recent Mortgage that was taken out on this home.
Original Mortgage
$105,600
Interest Rate
7.97%
Create a Home Valuation Report for This Property
The Home Valuation Report is an in-depth analysis detailing your home's value as well as a comparison with similar homes in the area
Home Values in the Area
Average Home Value in this Area
Purchase History
| Date | Buyer | Sale Price | Title Company |
|---|---|---|---|
| Mayenschein Laura R | $164,000 | Chicago Title | |
| Topp Loretta S | $98,000 | Ticor | |
| Wells Fargo Bank Na | -- | None Available | |
| Simon Michael J | $132,000 | First American Title |
Source: Public Records
Mortgage History
| Date | Status | Borrower | Loan Amount |
|---|---|---|---|
| Open | Mayenschein Laura R | $161,029 | |
| Previous Owner | Simon Michael J | $105,600 |
Source: Public Records
Tax History
| Year | Tax Paid | Tax Assessment Tax Assessment Total Assessment is a certain percentage of the fair market value that is determined by local assessors to be the total taxable value of land and additions on the property. | Land | Improvement |
|---|---|---|---|---|
| 2024 | $4,204 | $76,325 | $13,786 | $62,539 |
| 2023 | $4,868 | $65,226 | $12,987 | $52,239 |
| 2022 | $4,868 | $63,511 | $8,661 | $54,850 |
| 2021 | $4,768 | $59,865 | $8,164 | $51,701 |
| 2020 | $4,748 | $59,009 | $8,047 | $50,962 |
| 2019 | $4,573 | $56,587 | $7,717 | $48,870 |
| 2018 | $4,142 | $49,319 | $11,630 | $37,689 |
| 2017 | $4,320 | $45,586 | $10,750 | $34,836 |
| 2016 | $4,412 | $41,692 | $9,832 | $31,860 |
| 2015 | $4,278 | $38,906 | $9,175 | $29,731 |
| 2014 | $4,438 | $41,294 | $10,491 | $30,803 |
| 2012 | $4,145 | $43,029 | $10,932 | $32,097 |
Source: Public Records
Map
Nearby Homes
- 34945 N Leonard Ave
- 34785 N Gogol Ave
- 28448 W Big Hollow Rd
- 35116 N Lake Matthews Trail
- 35100 N Indian Trail
- 35049 N Edgewater Ln
- 28986 W Manitoba Trail
- 3321 N Bayview Ln
- 35403 N 2nd Ave
- 35769 N Cedar Island
- 27283 W Nippersink Rd
- 411 Kings Rd
- 596 Fox Ridge Dr
- 187 Rabbit Run
- 994 Reserve Ct
- 8 Cross St
- 35242 N Moody St
- 35 Tremont Rd
- 2032 Wentworth Dr
- 27254 W Nippersink Rd
- 34871 N Leonard Ave
- 34841 N Leonard Ave
- 34872 N Gogol Ave
- 34829 N Leonard Ave
- 34850 N Gogol Ave
- 34895 N Leonard Ave
- 34894 N Gogol Ave
- 34858 N Leonard Ave
- 34836 N Gogol Ave
- 34846 N Leonard Ave
- 34760 N Gogol Ave
- 34882 N Leonard Ave
- 34915 N Leonard Ave
- 34836 N Leonard Ave
- 34920 N Gogol Ave
- 34812 N Gogol Ave
- 34900 N Leonard Ave
- 34810 N Leonard Ave
- 34931 N Leonard Ave
- 34924 N Leonard Ave