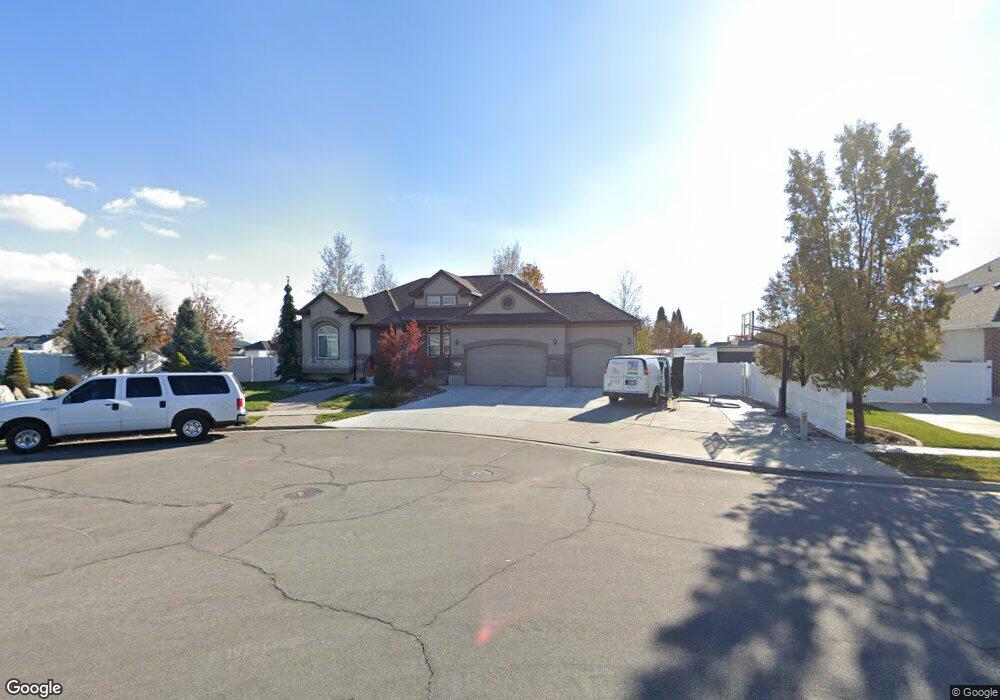
3487 W 900 N Layton, UT 84041
Estimated Value: $829,000 - $955,000
7
Beds
7
Baths
4,864
Sq Ft
$183/Sq Ft
Est. Value
About This Home
This home is located at 3487 W 900 N, Layton, UT 84041 and is currently estimated at $888,745, approximately $182 per square foot. 3487 W 900 N is a home located in Davis County with nearby schools including Sand Springs Elementary School, Legacy Junior High School, and Layton High School.
Ownership History
Date
Name
Owned For
Owner Type
Purchase Details
Closed on
Feb 12, 2020
Sold by
Stefan Gary W and Stefan Sheereen L
Bought by
Molyneux Michael Ellis
Current Estimated Value
Home Financials for this Owner
Home Financials are based on the most recent Mortgage that was taken out on this home.
Original Mortgage
$290,000
Outstanding Balance
$256,818
Interest Rate
3.72%
Mortgage Type
New Conventional
Estimated Equity
$631,927
Purchase Details
Closed on
Jan 10, 2008
Sold by
Stefan Robert E
Bought by
Stefan Gary W and Stefan Sheereen L
Purchase Details
Closed on
Jul 23, 2007
Sold by
North Ivory
Bought by
Stefan Robert E
Home Financials for this Owner
Home Financials are based on the most recent Mortgage that was taken out on this home.
Original Mortgage
$92,000
Interest Rate
6.73%
Mortgage Type
Stand Alone Second
Create a Home Valuation Report for This Property
The Home Valuation Report is an in-depth analysis detailing your home's value as well as a comparison with similar homes in the area
Home Values in the Area
Average Home Value in this Area
Purchase History
| Date | Buyer | Sale Price | Title Company |
|---|---|---|---|
| Molyneux Michael Ellis | -- | Backman Title Servic | |
| Stefan Gary W | -- | Cottonwood Title Ins Agency | |
| Stefan Robert E | -- | Cottonwood Title Ins Agency |
Source: Public Records
Mortgage History
| Date | Status | Borrower | Loan Amount |
|---|---|---|---|
| Open | Molyneux Michael Ellis | $290,000 | |
| Previous Owner | Stefan Robert E | $92,000 | |
| Previous Owner | Stefan Robert E | $368,000 |
Source: Public Records
Tax History
| Year | Tax Paid | Tax Assessment Tax Assessment Total Assessment is a certain percentage of the fair market value that is determined by local assessors to be the total taxable value of land and additions on the property. | Land | Improvement |
|---|---|---|---|---|
| 2025 | $4,648 | $487,850 | $158,033 | $329,817 |
| 2024 | $4,504 | $476,300 | $171,756 | $304,544 |
| 2023 | $4,367 | $814,000 | $194,399 | $619,601 |
| 2022 | $4,679 | $473,550 | $105,168 | $368,382 |
| 2021 | $4,101 | $619,000 | $157,668 | $461,332 |
| 2020 | $3,701 | $536,000 | $136,885 | $399,115 |
| 2019 | $3,490 | $495,000 | $123,840 | $371,160 |
| 2018 | $3,224 | $459,000 | $109,684 | $349,316 |
| 2016 | $3,184 | $233,860 | $48,276 | $185,584 |
| 2015 | $3,286 | $229,130 | $48,276 | $180,854 |
| 2014 | $2,795 | $199,286 | $48,276 | $151,010 |
| 2013 | -- | $225,924 | $42,413 | $183,511 |
Source: Public Records
Map
Nearby Homes
Your Personal Tour Guide
Ask me questions while you tour the home.